Postgraduate entrance examination data set : Dataset Download
Run the tool :jupyter notebook
The blog analyzes the information data of postgraduate entrance examination and enrollment in major universities , have a look :
I hope it will help my friends , If you have any questions or need to improve, you can leave a message in the comment area .
Libraries involved :
Pandas — Data processing
Pyecharts — Data visualization
Visualization part :
Histogram — Bar
Pictogram — PictorialBar
Clouds of words — stylecloud
Combined components — Grid
!pip install stylecloud
import re
import stylecloud
from PIL import Image
import numpy as np
import pandas as pd
from collections import Counter
from pyecharts.charts import Line,PictorialBar,Bar,Grid
from pyecharts import options as opts
from pyecharts.globals import ThemeType
from pyecharts.globals import SymbolType
from pyecharts.commons.utils import JsCode
df = pd.read_csv('/home/mw/input/202201106373/ Postgraduate entrance examination information .csv')
df.head(10)
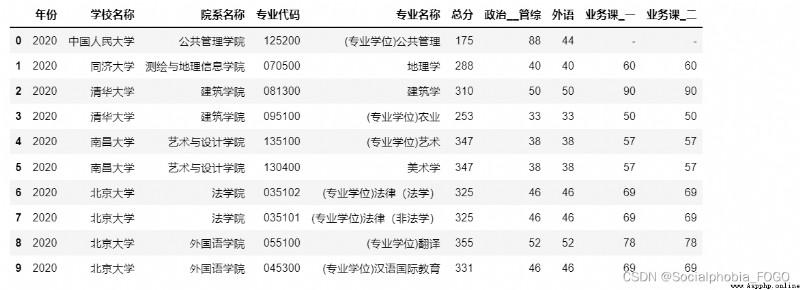
df.info()
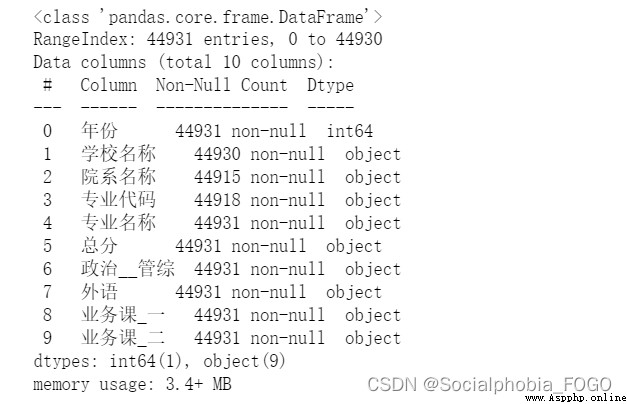
You can see , School name 、 The name of the Department 、 Some data are missing in columns such as specialty code
df.dropna(inplace=True)
df_2020 = df[df[' year '] == 2020]
df_2020.info()
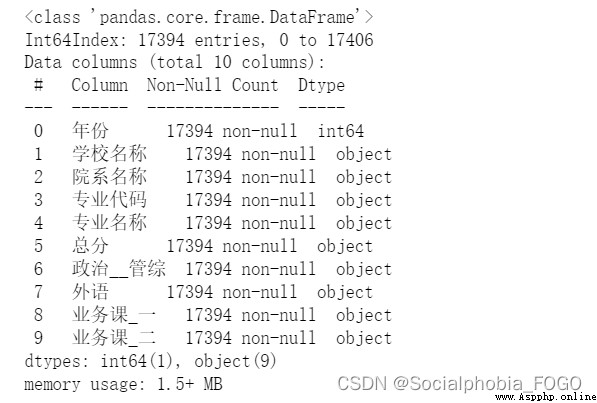
You can see , No missing data
df_2020.duplicated().sum()

df_2020.duplicated(subset=[" School name "," Professional code "]).sum()

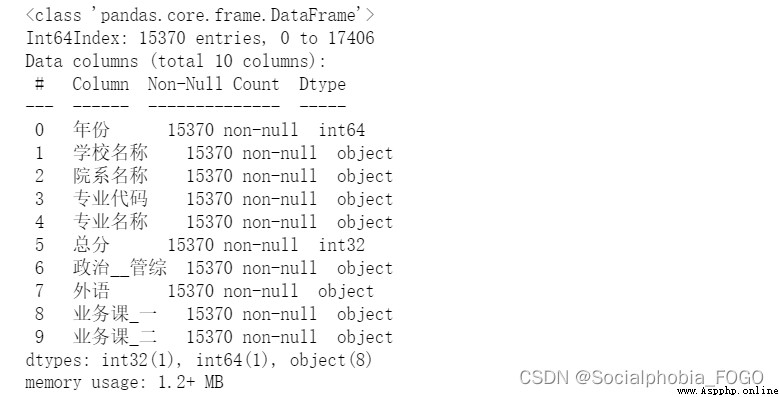
df_2020 = df_2020[~(df_2020[' Total score ']=='-')]
df_2020[' Total score '] = df_2020[' Total score '].astype('int')
df_2020.info()
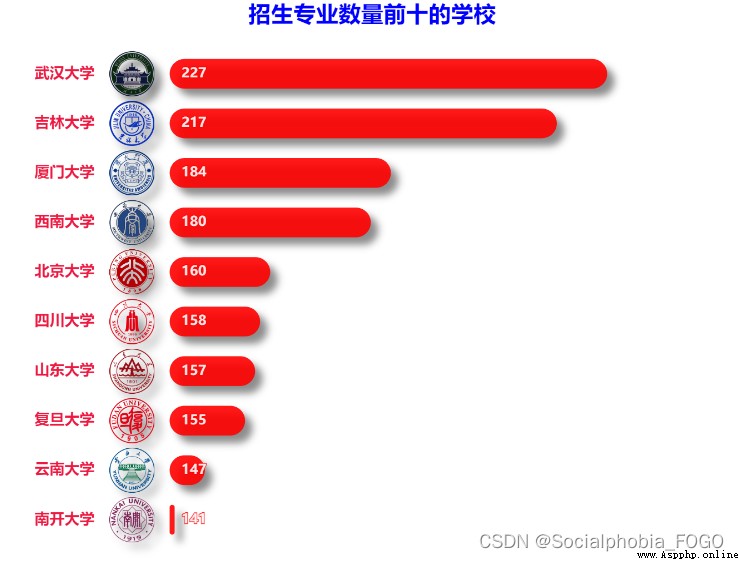
df_major_10 = df_2020.groupby(' School name ')[' Major name '].count().sort_values(ascending = False)[:10].to_frame(' Number ')
df_major_10 = df_major_10 = df_major_10.sort_values(by=' Number ').sort_values(by=' Number ')
schs = list(df_major_10.index)
sch_icons = {

' Wuhan University ': 'image://https://www.shanghairanking.cn/_uni/logo/46182017.png',
' Jilin University ': 'image://https://www.shanghairanking.cn/_uni/logo/76557044.png',
' Xiamen University ': 'image://https://www.shanghairanking.cn/_uni/logo/14008229.png',
' Southwest University ': 'image://https://www.shanghairanking.cn/_uni/logo/68012227.png',
' Peking University, ': 'image://https://www.shanghairanking.cn/_uni/logo/86350223.png',
' Sichuan University ': 'image://https://www.shanghairanking.cn/_uni/logo/75651370.png',
' Shandong University ': 'image://https://www.shanghairanking.cn/_uni/logo/97189370.png',
' Fudan University ': 'image://https://www.shanghairanking.cn/_uni/logo/28312850.png',
' Yunnan University ': 'image://https://www.shanghairanking.cn/_uni/logo/31586909.png',
' Nankai University ': 'image://https://www.shanghairanking.cn/_uni/logo/44629152.png'
}
icons = []
for sch in schs:
icons.append(dict(name=sch, value=1, symbol=sch_icons[sch]))
p1 = (
PictorialBar()
.add_xaxis(schs)
.add_yaxis("",
icons,
label_opts=opts.LabelOpts(is_show=False),
category_gap='40%',
symbol_pos='start',
symbol_size=60,
is_symbol_clip=False,
itemstyle_opts={
"normal": {

'shadowBlur': 10,
'shadowColor': 'rgba(0, 0, 0, 0.5)',
'shadowOffsetX': 10,
'shadowOffsetY': 10,}
})
.set_global_opts(
xaxis_opts=opts.AxisOpts(is_show=False),
yaxis_opts=opts.AxisOpts(
is_show=True,
is_scale=True,
axistick_opts=opts.AxisTickOpts(is_show=False),
axislabel_opts=opts.LabelOpts(font_size=20,color='#ed1941',font_weight=700,margin=20),
splitline_opts=opts.SplitLineOpts(is_show=False,
linestyle_opts=opts.LineStyleOpts(type_='dashed')),
axisline_opts=opts.AxisLineOpts(is_show=False,
linestyle_opts=opts.LineStyleOpts(width=2, color='#DB7093'))
),
)
.reversal_axis()
)
b1 = (
Bar()
.add_xaxis(schs)
.add_yaxis('', df_major_10[' Number '].values.tolist(), category_gap='40%')
.set_series_opts(
label_opts=opts.LabelOpts(
position="insideLeft",
vertical_align='middle',
horizontal_align='top',
font_size=18,
font_weight='bold',
formatter=' {c} '),
itemstyle_opts={

'opacity': 0.9,
'shadowBlur': 10,
'shadowOffsetX': 10,
'shadowOffsetY': 10,
'shadowColor': 'rgba(0, 0, 0, 0.5)',
'barBorderRadius': [30, 30, 30, 30],
'color':'red'
}
)
.set_global_opts(
yaxis_opts=opts.AxisOpts(is_show=False),
xaxis_opts=opts.AxisOpts(
is_scale=True,
type_="value",
name_location="middle",
position='top',
name_textstyle_opts=opts.TextStyleOpts(font_size=14, font_weight='bold',),
axisline_opts=opts.AxisLineOpts(is_show=False),
axislabel_opts=opts.LabelOpts(is_show=False),
splitline_opts=opts.SplitLineOpts(is_show=False),
axistick_opts=opts.AxisTickOpts(is_show=False),),
title_opts=opts.TitleOpts(title=' The top ten schools in terms of enrollment ',
title_textstyle_opts=opts.TextStyleOpts(color="blue",font_size=30),
pos_top='2%',pos_left = 'center'),
)
.reversal_axis()
)
grid = Grid(init_opts=opts.InitOpts(theme='light', width='1000px', height='800px'))
grid.add(p1, is_control_axis_index=False, grid_opts=opts.GridOpts(pos_left='15%', pos_right='80%', pos_top='10%'))
grid.add(b1, is_control_axis_index=False, grid_opts=opts.GridOpts(pos_left='23%', pos_right='10%', pos_top='10%'))
grid.render_notebook()
df_tmp = df_2020[df_2020[" Major name "].str.contains(' Computer science and technology | business administration | accounting | Management science and engineering | Finance | law | Materials science and engineering | Public administration | Mechanical engineering | mathematics ')]
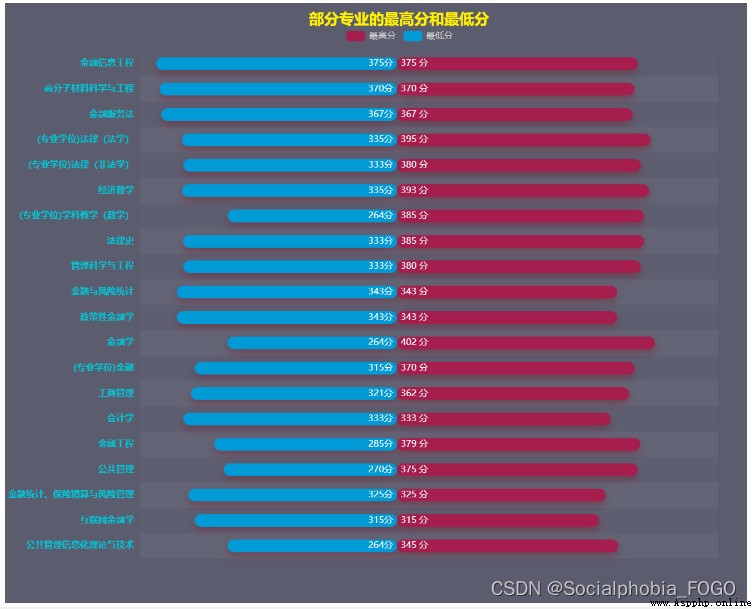
df_major = df_tmp.groupby(' Major name ')[' Total score '].agg([np.mean, np.max,np.min])
df_major = df_major.sort_values(by=['mean'],ascending=False)[:20]
df_major['amin'] = df_major['amin']*(-1)
bar = (
Bar()
.add_xaxis(df_major.index.tolist())
.add_yaxis(' The highest ',
df_major['amax'].tolist()[::-1],
z_level=1,
stack='1',
category_gap='50%',
tooltip_opts=opts.TooltipOpts(is_show=False),
label_opts=opts.LabelOpts(position='insideLeft', formatter='{c} branch '),
itemstyle_opts={
"normal": {

"barBorderRadius": [30, 30, 30, 30],
'shadowBlur': 10,
'shadowColor': 'rgba(120, 36, 50, 0.5)',
'shadowOffsetY': 5,
'color':'#a61e4d',
}
}
)
.add_yaxis(' Lowest score ',
df_major['amin'].tolist()[::-1],
z_level=1,
stack='1',
category_gap='50%',
tooltip_opts=opts.TooltipOpts(is_show=False),
label_opts=opts.LabelOpts(position='insideRight',
formatter=JsCode(
"""function(params) { if (params.value && params.value < 0) { return -params.value + ' branch '; } }"""
),
),
itemstyle_opts={
"normal": {

"barBorderRadius": [30, 30, 30, 30],
'shadowBlur': 10,
'shadowColor': 'rgba(120, 36, 50, 0.5)',
'shadowOffsetY': 5,
'color':'#009ad6',
}
}
)
.set_global_opts(title_opts=opts.TitleOpts(title=' The highest and lowest scores of some majors ',pos_top='1%',pos_left='40%',
title_textstyle_opts=opts.TextStyleOpts(font_size=20,color='#fff000')),
legend_opts=opts.LegendOpts(is_show=True, pos_top='4%',pos_left='45%'),
datazoom_opts=opts.DataZoomOpts(type_='inside',
range_start=10, # Set the start stop position ,50%-100%
range_end=100,
orient='vertical'),
xaxis_opts=opts.AxisOpts(is_show=False, max_=500),
yaxis_opts=opts.AxisOpts(axisline_opts=opts.AxisLineOpts(is_show=False),
axistick_opts=opts.AxisTickOpts(is_show=False),
axislabel_opts=opts.LabelOpts(color='#00c6d7', font_size=12, font_weight='bold')),
)
).reversal_axis()
grid = (
Grid(init_opts=opts.InitOpts(theme='purple-passion', width='1000px', height='800px'))
.add(bar, grid_opts=opts.GridOpts(pos_top='8%', pos_left='18%', pos_right='5%'))
)
grid.render_notebook()
color_js = """new echarts.graphic.LinearGradient(0, 1, 0, 0, [{offset: 0, color: '#FFFFFF'}, {offset: 1, color: '#ed1941'}], false)"""
range_colors=['#fff5f0','#fee0d2','#fcbba1','#fc9272','#fb6a4a','#ef3b2c','#cb181d','#99000d']
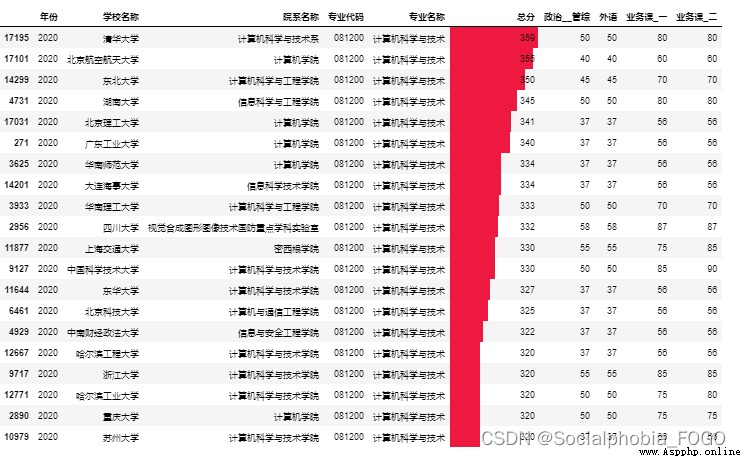
df_computer = df_2020.loc[df_2020[' Major name ']==' Computer science and technology ',:]
df_computer = df_computer.sort_values(by=' Total score ',ascending=False)[:20]
df_computer[' Total score '] = df_computer[' Total score '].astype('int')
df_computer.style.bar(subset=[' Total score '],color='#ed1941', vmin=300, vmax=360)
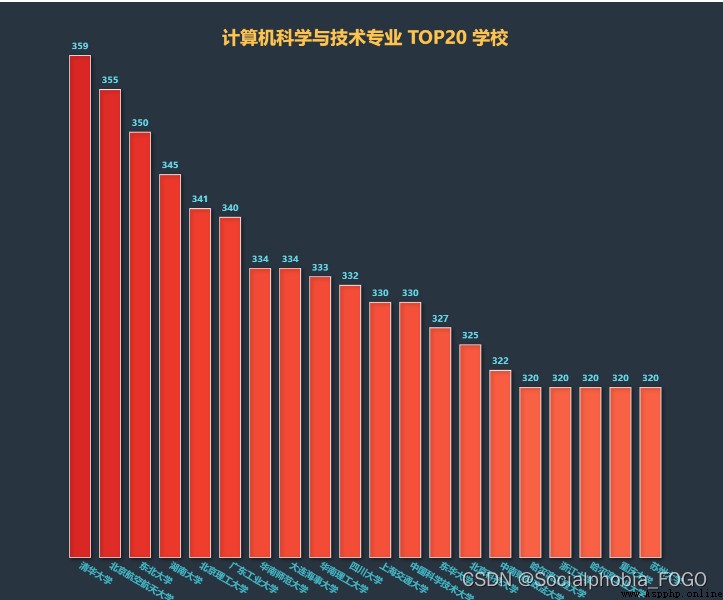
x_data = df_computer[' School name '].values.tolist()
y_data = df_computer[' Total score '].values.tolist()
bar2 = (
Bar(init_opts=opts.InitOpts(theme='chalk',width='1000px', height='800px'))
.add_xaxis(x_data)
.add_yaxis('', y_data,
category_gap='30%',
itemstyle_opts={

'normal': {

'shadowColor': 'rgba(0, 0, 0, .5)',
'shadowBlur': 5,
'shadowOffsetY': 2,
'shadowOffsetX': 2,
'borderColor': '#fff'
}
}
)
.set_series_opts(label_opts=opts.LabelOpts(font_weight='bold',font_size=12, color='#66d9e8' ))
.set_global_opts(
xaxis_opts=opts.AxisOpts(axislabel_opts=opts.LabelOpts(rotate=-30,font_size=12,font_weight='bold', color="#41b6c4",margin=10),
axisline_opts=opts.AxisLineOpts(is_show=False),
axistick_opts=opts.AxisTickOpts(is_show=False),
),
yaxis_opts=opts.AxisOpts(is_show=False,
max_=360,
min_=300,
axisline_opts=opts.AxisLineOpts(is_show=False),
axistick_opts=opts.AxisTickOpts(is_show=False)
),
title_opts=opts.TitleOpts(
title=' Computer science and technology TOP20 School ',
pos_left='center',
pos_top='4%',
title_textstyle_opts=opts.TextStyleOpts(color='#fec44f', font_size=24, font_weight='bold')
),
visualmap_opts=opts.VisualMapOpts(
is_show=False,
max_=400,
min_=200,
range_color=range_colors
),
)
)
bar2.render_notebook()
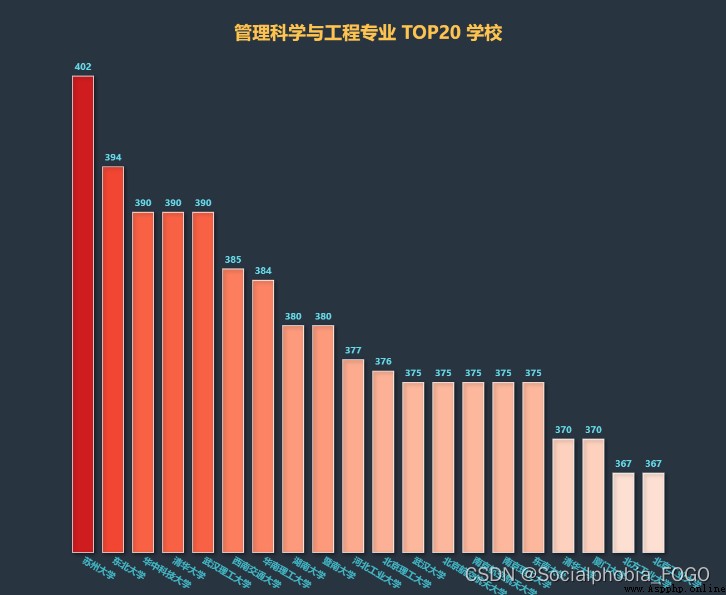
df_management = df_2020.loc[df_2020[' Major name '].str.contains(' Management science and engineering '),:]
df_management = df_management.sort_values(by=' Total score ',ascending=False)[:20]
x_data = df_management[' School name '].values.tolist()
y_data = df_management[' Total score '].values.tolist()
bar2 = (
Bar(init_opts=opts.InitOpts(theme='chalk',width='1000px', height='800px'))
.add_xaxis(x_data)
.add_yaxis('', y_data,
category_gap='30%',
itemstyle_opts={

'normal': {

'shadowColor': 'rgba(0, 0, 0, .5)',
'shadowBlur': 5,
'shadowOffsetY': 2,
'shadowOffsetX': 2,
'borderColor': '#fff'
}
}
)
.set_series_opts(label_opts=opts.LabelOpts(font_weight='bold',font_size=12, color='#66d9e8' ))
.set_global_opts(
xaxis_opts=opts.AxisOpts(axislabel_opts=opts.LabelOpts(rotate=-30,font_size=12,font_weight='bold', color="#41b6c4",margin=10),
axisline_opts=opts.AxisLineOpts(is_show=False),
axistick_opts=opts.AxisTickOpts(is_show=False),
),
yaxis_opts=opts.AxisOpts(is_show=False,
max_=405,
min_=360,
axisline_opts=opts.AxisLineOpts(is_show=False),
axistick_opts=opts.AxisTickOpts(is_show=False)
),
title_opts=opts.TitleOpts(
title=' Management science and engineering TOP20 School ',
pos_left='center',
pos_top='4%',
title_textstyle_opts=opts.TextStyleOpts(color='#fec44f', font_size=24, font_weight='bold')
),
visualmap_opts=opts.VisualMapOpts(
is_show=False,
max_=410,
min_=360,
range_color=range_colors
),
)
)
bar2.render_notebook()
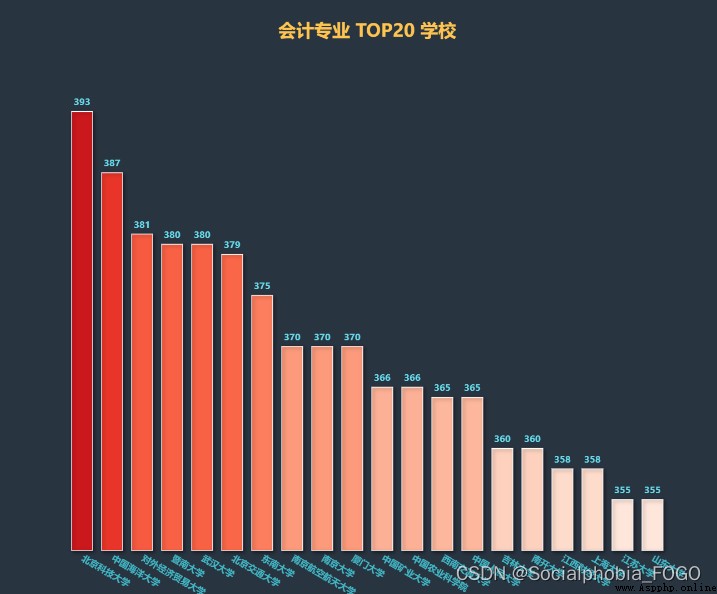
df_accountant = df_2020.loc[df_2020[' Major name '].str.contains(' accounting '),:]
df_accountant = df_accountant.sort_values(by=' Total score ',ascending=False)[:20]
x_data = df_accountant[' School name '].values.tolist()
y_data = df_accountant[' Total score '].values.tolist()
bar2 = (
Bar(init_opts=opts.InitOpts(theme='chalk',width='1000px', height='800px'))
.add_xaxis(x_data)
.add_yaxis('', y_data,
category_gap='30%',
itemstyle_opts={

'normal': {

'shadowColor': 'rgba(0, 0, 0, .5)',
'shadowBlur': 5,
'shadowOffsetY': 2,
'shadowOffsetX': 2,
'borderColor': '#fff'
}
}
)
.set_series_opts(label_opts=opts.LabelOpts(font_weight='bold',font_size=12, color='#66d9e8' ))
.set_global_opts(
xaxis_opts=opts.AxisOpts(axislabel_opts=opts.LabelOpts(rotate=-30,font_size=12,font_weight='bold', color="#41b6c4",margin=10),
axisline_opts=opts.AxisLineOpts(is_show=False),
axistick_opts=opts.AxisTickOpts(is_show=False),
),
yaxis_opts=opts.AxisOpts(is_show=False,
max_=400,
min_=350,
axisline_opts=opts.AxisLineOpts(is_show=False),
axistick_opts=opts.AxisTickOpts(is_show=False)
),
title_opts=opts.TitleOpts(
title=' accounting profession TOP20 School ',
pos_left='center',
pos_top='4%',
title_textstyle_opts=opts.TextStyleOpts(color='#fec44f', font_size=24, font_weight='bold')
),
visualmap_opts=opts.VisualMapOpts(
is_show=False,
max_=400,
min_=350,
range_color=range_colors
),
)
)
bar2.render_notebook()
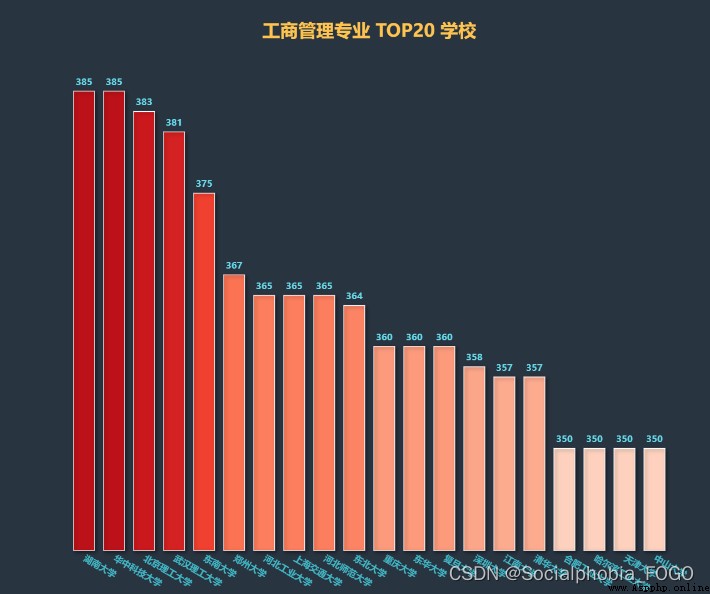
df_mba = df_2020.loc[df_2020[' Major name '].str.contains(' business administration '),:]
df_mba = df_mba.sort_values(by=' Total score ',ascending=False)[:20]
x_data = df_mba[' School name '].values.tolist()
y_data = df_mba[' Total score '].values.tolist()
bar2 = (
Bar(init_opts=opts.InitOpts(theme='chalk',width='1000px', height='800px'))
.add_xaxis(x_data)
.add_yaxis('', y_data,
category_gap='30%',
itemstyle_opts={

'normal': {

'shadowColor': 'rgba(0, 0, 0, .5)',
'shadowBlur': 5,
'shadowOffsetY': 2,
'shadowOffsetX': 2,
'borderColor': '#fff'
}
}
)
.set_series_opts(label_opts=opts.LabelOpts(font_weight='bold',font_size=12, color='#66d9e8' ))
.set_global_opts(
xaxis_opts=opts.AxisOpts(axislabel_opts=opts.LabelOpts(rotate=-30,font_size=12,font_weight='bold', color="#41b6c4",margin=10),
axisline_opts=opts.AxisLineOpts(is_show=False),
axistick_opts=opts.AxisTickOpts(is_show=False),
),
yaxis_opts=opts.AxisOpts(is_show=False,
max_=390,
min_=340,
axisline_opts=opts.AxisLineOpts(is_show=False),
axistick_opts=opts.AxisTickOpts(is_show=False)
),
title_opts=opts.TitleOpts(
title=' Business Administration TOP20 School ',
pos_left='center',
pos_top='4%',
title_textstyle_opts=opts.TextStyleOpts(color='#fec44f', font_size=24, font_weight='bold')
),
visualmap_opts=opts.VisualMapOpts(
is_show=False,
max_=390,
min_=340,
range_color=range_colors
),
)
)
bar2.render_notebook()
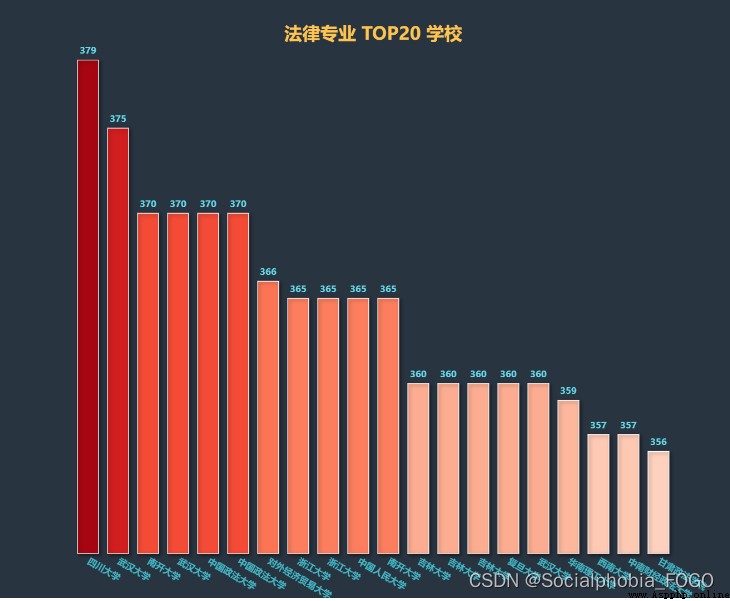
df_law = df_2020.loc[df_2020[' Major name '].str.contains(' law '),:]
df_law = df_law.sort_values(by=' Total score ',ascending=False)[:20]
x_data = df_law[' School name '].values.tolist()
y_data = df_law[' Total score '].values.tolist()
bar2 = (
Bar(init_opts=opts.InitOpts(theme='chalk',width='1000px', height='800px'))
.add_xaxis(x_data)
.add_yaxis('', y_data,
category_gap='30%',
itemstyle_opts={

'normal': {

'shadowColor': 'rgba(0, 0, 0, .5)',
'shadowBlur': 5,
'shadowOffsetY': 2,
'shadowOffsetX': 2,
'borderColor': '#fff'
}
}
)
.set_series_opts(label_opts=opts.LabelOpts(font_weight='bold',font_size=12, color='#66d9e8' ))
.set_global_opts(
xaxis_opts=opts.AxisOpts(axislabel_opts=opts.LabelOpts(rotate=-30,font_size=12,font_weight='bold', color="#41b6c4",margin=10),
axisline_opts=opts.AxisLineOpts(is_show=False),
axistick_opts=opts.AxisTickOpts(is_show=False),
),
yaxis_opts=opts.AxisOpts(is_show=False,
max_=380,
min_=350,
axisline_opts=opts.AxisLineOpts(is_show=False),
axistick_opts=opts.AxisTickOpts(is_show=False)
),
title_opts=opts.TitleOpts(
title=' Law major TOP20 School ',
pos_left='center',
pos_top='4%',
title_textstyle_opts=opts.TextStyleOpts(color='#fec44f', font_size=24, font_weight='bold')
),
visualmap_opts=opts.VisualMapOpts(
is_show=False,
max_=380,
min_=350,
range_color=range_colors
),
)
)
bar2.render_notebook()
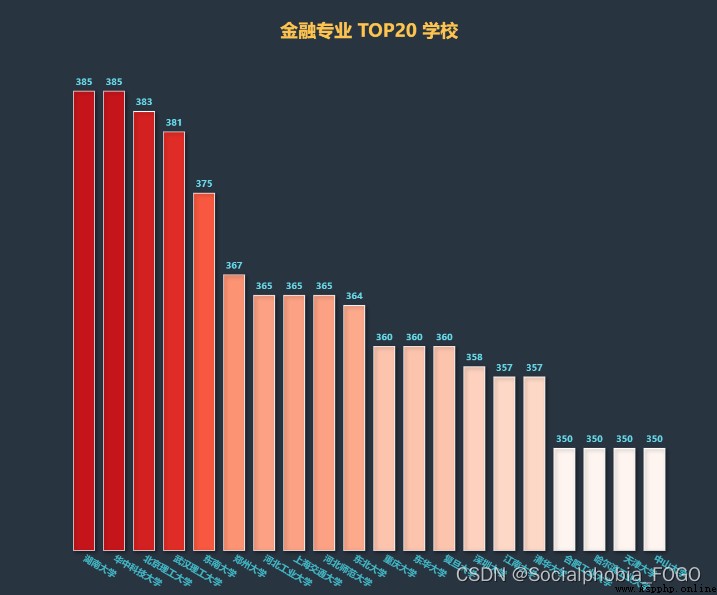
df_finance = df_2020.loc[df_2020[' Major name '].str.contains(' Finance '),:]
df_finance = df_finance.sort_values(by=' Total score ',ascending=False)[:20]
x_data = df_mba[' School name '].values.tolist()
y_data = df_mba[' Total score '].values.tolist()
bar2 = (
Bar(init_opts=opts.InitOpts(theme='chalk',width='1000px', height='800px'))
.add_xaxis(x_data)
.add_yaxis('', y_data,
category_gap='30%',
itemstyle_opts={

'normal': {

'shadowColor': 'rgba(0, 0, 0, .5)',
'shadowBlur': 5,
'shadowOffsetY': 2,
'shadowOffsetX': 2,
'borderColor': '#fff'
}
}
)
.set_series_opts(label_opts=opts.LabelOpts(font_weight='bold',font_size=12, color='#66d9e8' ))
.set_global_opts(
xaxis_opts=opts.AxisOpts(axislabel_opts=opts.LabelOpts(rotate=-30,font_size=12,font_weight='bold', color="#41b6c4",margin=10),
axisline_opts=opts.AxisLineOpts(is_show=False),
axistick_opts=opts.AxisTickOpts(is_show=False),
),
yaxis_opts=opts.AxisOpts(is_show=False,
max_=390,
min_=340,
axisline_opts=opts.AxisLineOpts(is_show=False),
axistick_opts=opts.AxisTickOpts(is_show=False)
),
title_opts=opts.TitleOpts(
title=' Finance TOP20 School ',
pos_left='center',
pos_top='4%',
title_textstyle_opts=opts.TextStyleOpts(color='#fec44f', font_size=24, font_weight='bold')
),
visualmap_opts=opts.VisualMapOpts(
is_show=False,
max_=390,
min_=350,
range_color=range_colors
),
)
)
bar2.render_notebook()
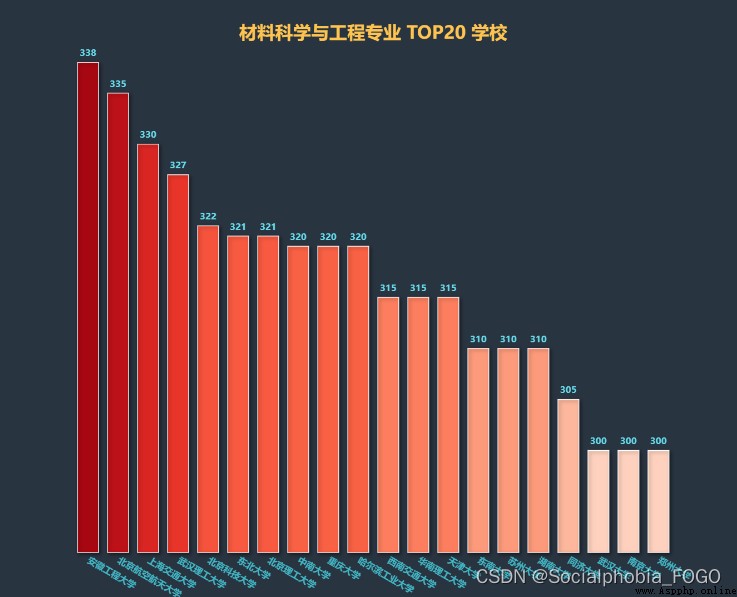
df_materials = df_2020.loc[df_2020[' Major name '].str.contains(' Materials science and engineering '),:]
df_materials = df_materials.sort_values(by=' Total score ',ascending=False)[:20]
x_data = df_materials[' School name '].values.tolist()
y_data = df_materials[' Total score '].values.tolist()
bar2 = (
Bar(init_opts=opts.InitOpts(theme='chalk',width='1000px', height='800px'))
.add_xaxis(x_data)
.add_yaxis('', y_data,
category_gap='30%',
itemstyle_opts={

'normal': {

'shadowColor': 'rgba(0, 0, 0, .5)',
'shadowBlur': 5,
'shadowOffsetY': 2,
'shadowOffsetX': 2,
'borderColor': '#fff'
}
}
)
.set_series_opts(label_opts=opts.LabelOpts(font_weight='bold',font_size=12, color='#66d9e8' ))
.set_global_opts(
xaxis_opts=opts.AxisOpts(axislabel_opts=opts.LabelOpts(rotate=-30,font_size=12,font_weight='bold', color="#41b6c4",margin=10),
axisline_opts=opts.AxisLineOpts(is_show=False),
axistick_opts=opts.AxisTickOpts(is_show=False),
),
yaxis_opts=opts.AxisOpts(is_show=False,
max_=340,
min_=290,
axisline_opts=opts.AxisLineOpts(is_show=False),
axistick_opts=opts.AxisTickOpts(is_show=False)
),
title_opts=opts.TitleOpts(
title=' Materials science and Engineering TOP20 School ',
pos_left='center',
pos_top='4%',
title_textstyle_opts=opts.TextStyleOpts(color='#fec44f', font_size=24, font_weight='bold')
),
visualmap_opts=opts.VisualMapOpts(
is_show=False,
max_=340,
min_=290,
range_color=range_colors
),
)
)
bar2.render_notebook()
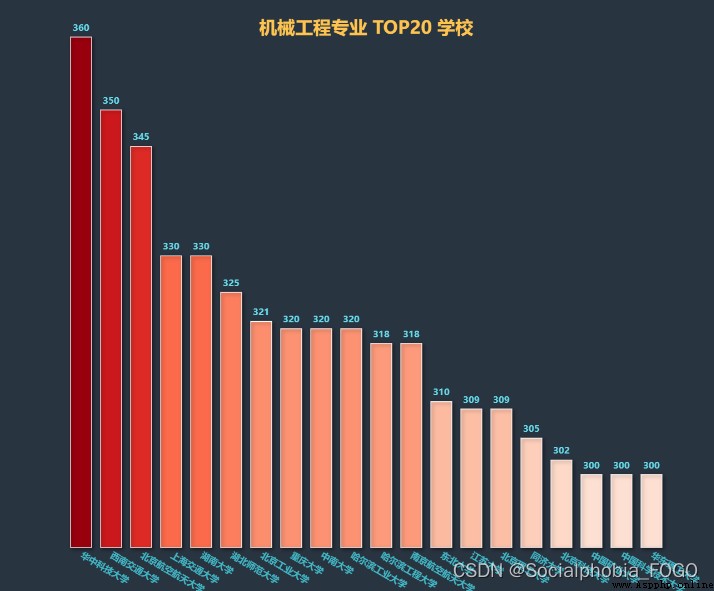
df_mechanical = df_2020.loc[df_2020[' Major name '].str.contains(' Mechanical engineering '),:]
df_mechanical = df_mechanical.sort_values(by=' Total score ',ascending=False)[:20]
x_data = df_mechanical[' School name '].values.tolist()
y_data = df_mechanical[' Total score '].values.tolist()
bar2 = (
Bar(init_opts=opts.InitOpts(theme='chalk',width='1000px', height='800px'))
.add_xaxis(x_data)
.add_yaxis('', y_data,
category_gap='30%',
itemstyle_opts={

'normal': {

'shadowColor': 'rgba(0, 0, 0, .5)',
'shadowBlur': 5,
'shadowOffsetY': 2,
'shadowOffsetX': 2,
'borderColor': '#fff'
}
}
)
.set_series_opts(label_opts=opts.LabelOpts(font_weight='bold',font_size=12, color='#66d9e8' ))
.set_global_opts(
xaxis_opts=opts.AxisOpts(axislabel_opts=opts.LabelOpts(rotate=-30,font_size=12,font_weight='bold', color="#41b6c4",margin=10),
axisline_opts=opts.AxisLineOpts(is_show=False),
axistick_opts=opts.AxisTickOpts(is_show=False),
),
yaxis_opts=opts.AxisOpts(is_show=False,
max_=360,
min_=290,
axisline_opts=opts.AxisLineOpts(is_show=False),
axistick_opts=opts.AxisTickOpts(is_show=False)
),
title_opts=opts.TitleOpts(
title=' Major in mechanical engineering TOP20 School ',
pos_left='center',
pos_top='4%',
title_textstyle_opts=opts.TextStyleOpts(color='#fec44f', font_size=24, font_weight='bold')
),
visualmap_opts=opts.VisualMapOpts(
is_show=False,
max_=360,
min_=290,
range_color=range_colors
),
)
)
bar2.render_notebook()
schools = df_2020[' School name '].values.tolist()
pic_name = ' School name .png'
stylecloud.gen_stylecloud(
text=' '.join(schools),
font_path=r'/home/mw/input/202201106373/STXINWEI.TTF',
palette='cartocolors.qualitative.Bold_5',
max_font_size=100,
icon_name='fas fa-graduation-cap',
background_color='#212529',
output_name=pic_name,
)
Image.open(pic_name)

major = df_2020[' Major name '].values.tolist()
pic_name = ' Major name .png'
stylecloud.gen_stylecloud(
text=' '.join(major),
font_path=r'/home/mw/input/202201106373/STXINWEI.TTF',
palette='cartocolors.qualitative.Bold_5',
max_font_size=100,
icon_name='fas fa-book-open',
background_color='#212529',
output_name=pic_name,
)
Image.open(pic_name)
