explain : This is a practical project of machine learning ( Incidental data + Code + file + Video Explanation ), If you need data + Code + file + Video Explanation You can get it directly at the end of the article .
1. Project background
Now , More and more 80,90 Buy a house or a car with a loan , For a while , The loan business provided by banks has become the trend of the times “ New favorite ”. Bank loan means that an individual or enterprise lends funds to an individual or enterprise who needs funds at a certain interest rate according to the policies of the country where the bank is located , An economic act in which a time limit for return is agreed .
In order to reduce the non-performing loan ratio , Ensure the safety of their own funds , Improve the level of risk control , Banks and other financial institutions will build a credit scoring card model to score customers according to their credit history data . According to the customer's credit score , It can estimate the possibility of customers' repayment on time , And decide whether to grant loans and the amount and interest rate of loans .
In this project, low variance method is used for feature selection , Using genetic algorithm to build credit scoring card model .
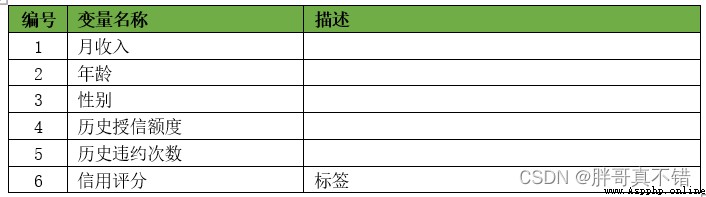
2. Data acquisition
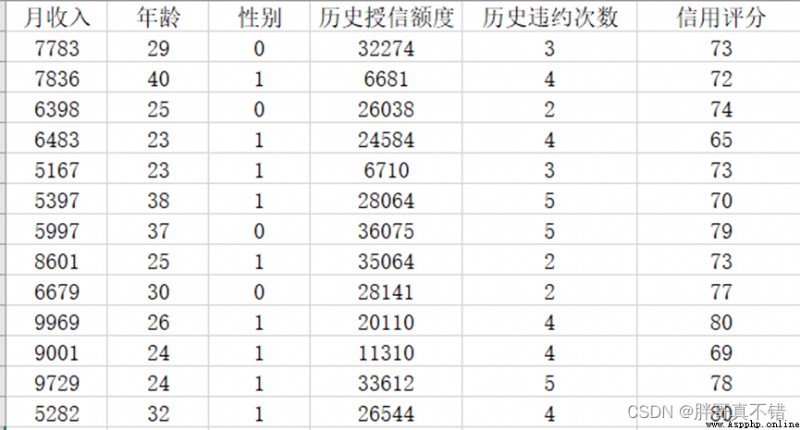
The modeling data comes from the network ( Compiled by the author of this project ), The statistics of data items are as follows :
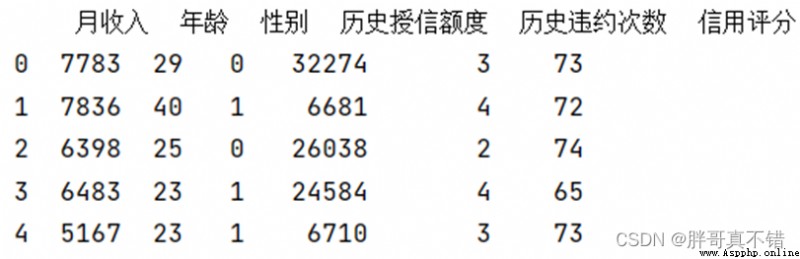
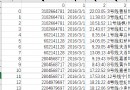
The details of the data are as follows ( Part of the show ):
3. Data preprocessing
3.1 use Pandas Tool view data
Use Pandas The tool head() Method to view the first five rows of data :
Key code :
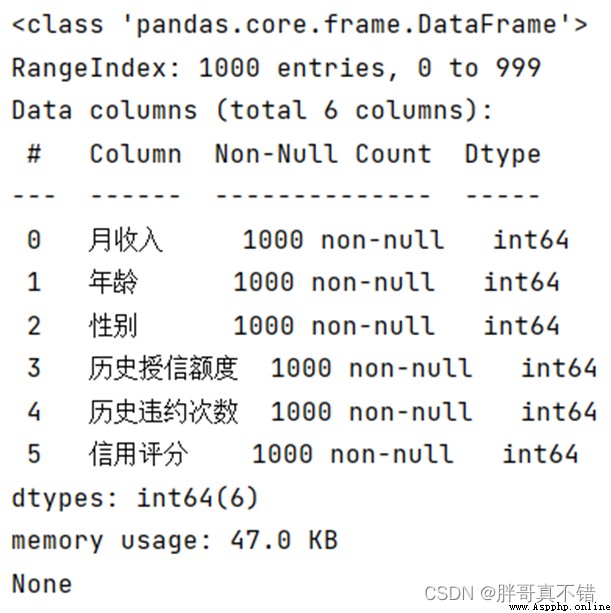
3.2 Missing data view
Use Pandas The tool info() Method to view data information :
You can see from the above picture that , All in all 6 A variable , There are no missing values in the data , common 1000 Data .
Key code :
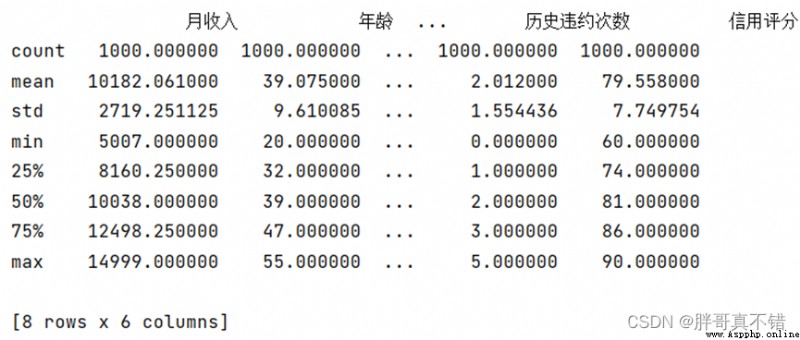
3.3 Descriptive statistics
adopt Pandas The tool describe() Method to see the average of the data 、 Standard deviation 、 minimum value 、 quantile 、 Maximum .
The key codes are as follows :

4. Exploratory data analysis
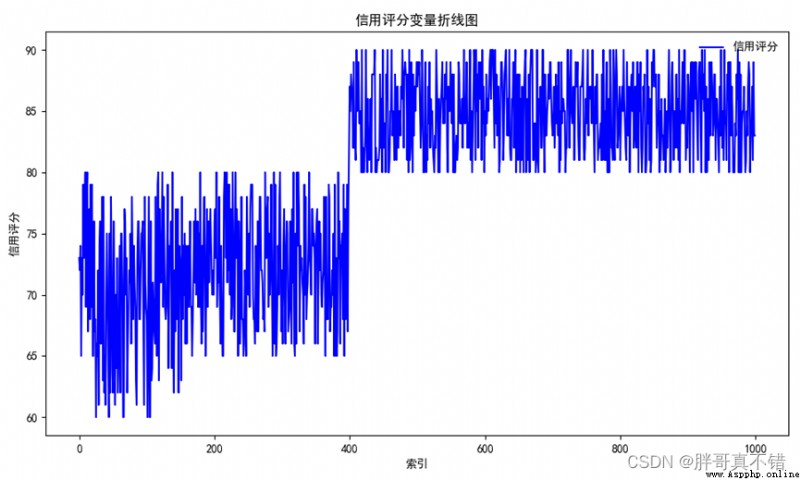
4.1 Line chart of credit score
use Matplotlib The tool plot() Methods draw a line chart :
As can be seen from the above figure , Most people have a credit rating of 65~75 and 80~90.
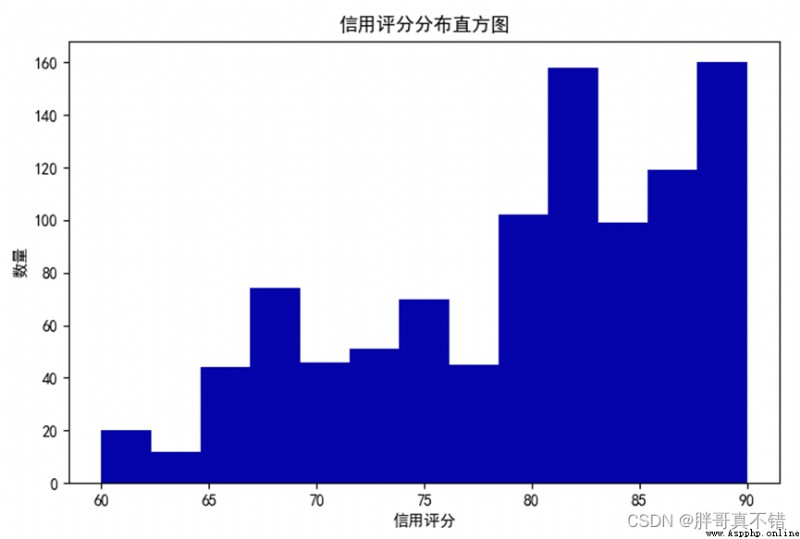
4.2 Credit score histogram
use Matplotlib The tool hist() Method draw histogram :
As you can see from the picture above , The credit score is at 80~90 The majority of people are divided , It shows that most people have good credit .
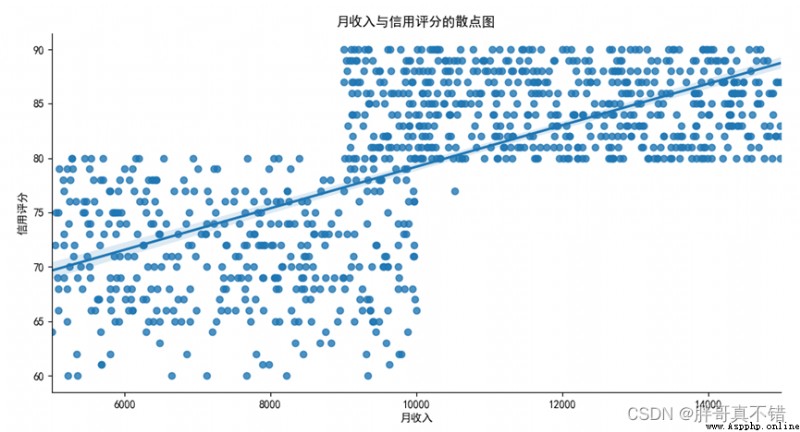
4.3 Scatter plot of data
The trend relationship between monthly income and credit score is shown through the fitting line of the scatter chart :
As you can see from the picture above , There is no linear relationship between monthly income and credit score .
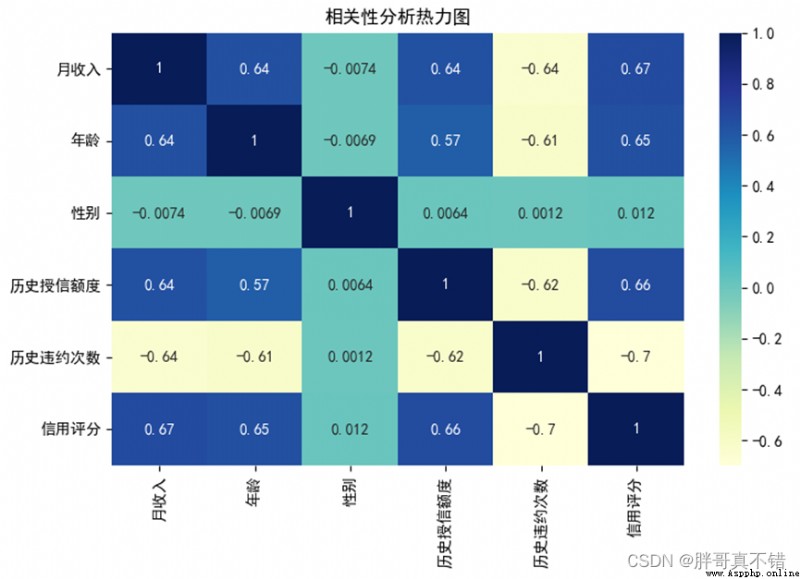
4.4 correlation analysis
As you can see from the above figure , The larger the value, the stronger the correlation , A positive value is a positive correlation 、 A negative value is a negative correlation .
5. Feature Engineering
5.1 Establish characteristic data and label data
The key codes are as follows :
5.2 Data set splitting
adopt train_test_split() Method according to 80% Training set 、20% Divide the test set , The key codes are as follows :
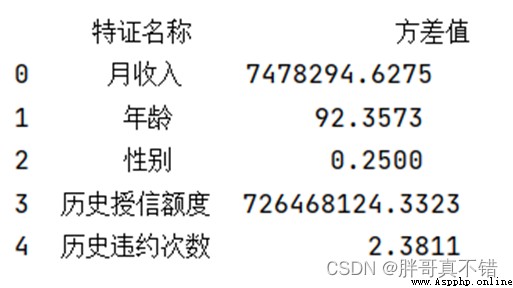
5.3 Low variance filtering feature selection
Use VarianceThreshold() Low variance filtering method for feature selection , The key codes are as follows :
The result returned :
As can be seen from the above figure , The threshold is 0.21, The variance values of all features are greater than 0.21, So there is no need to remove some features .
6. Build genetic algorithm regression model
Genetic algorithm combines population members iteratively based on creating initial population , Thus according to the parents “ features / Parameters ” The idea of creating children . At the end of each iteration , We do fitting tests , And the most suitable individuals will be taken from the original population + New populations are created . therefore , In each iteration , We will create new descendants , If offspring perform better , They can be used to replace existing individuals . This increases overall performance or at least remains the same for each iteration .
TPOT The main regressors supported are decision trees 、 Ensemble tree 、 Linear model 、xgboost.
The main use of TPOTRegressor Algorithm , For target regression .
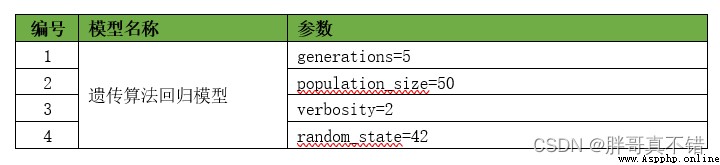
6.1 Model parameters
7. Model to evaluate
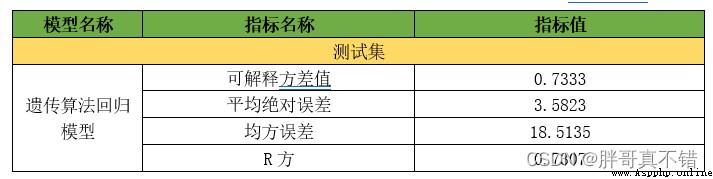
7.1 Evaluation indicators and results
The evaluation index mainly includes the interpretable variance value 、 Mean absolute error 、 Mean square error 、R Square value, etc .
As can be seen from the table above ,R Party for 73.07% The interpretable variance is 73.33%,GBDT The regression model works well , If you want to achieve better results , You can adjust the parameters ,generations Adjusted for 100,population_size Adjusted for 1000, But it will take a long time .
The key codes are as follows :
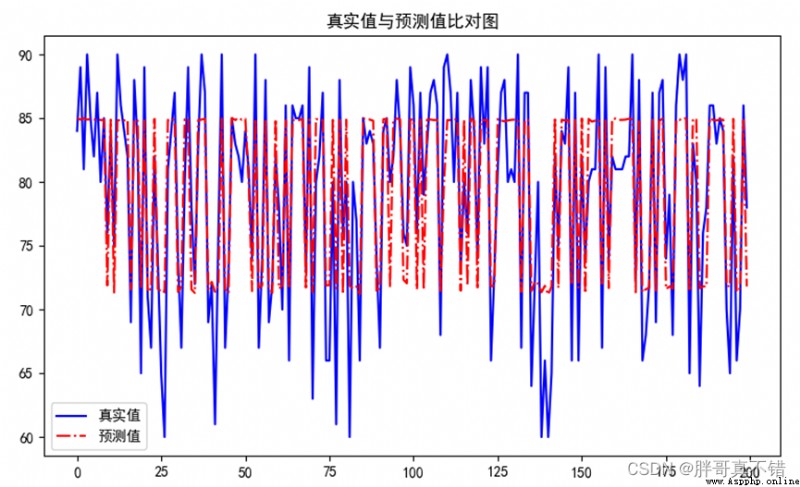
7.2 Comparison between real value and predicted value
It can be seen from the above figure that the fluctuations of the real value and the predicted value are basically the same , The fitting effect of the model is good .
8. Conclusion and Prospect
in summary , This paper adopts genetic algorithm regression model , Finally, it is proved that the model we proposed is effective . This model can be used for daily credit scoring .
The materials needed for the actual combat of this machine learning project , The project resources are as follows :
Project description :
link :https://pan.baidu.com/s/1dW3S1a6KGdUHK90W-lmA4w
Extraction code :bcbpIf the network disk fails , You can add blogger wechat :zy10178083