案例實操
問題描述一:統計出這些數據中不同類型的緊急情況的次數。
方案一:set方法
方案二:for遍歷整個DataFrame
方案三:添加一列,然後分類Groupby
時間序列分析
(一)生成一段時間范圍
(二)在DataFrame中使用時間序列
(三)pandas重采樣
降采樣(高頻數據到低頻數據):
升采樣(低頻數據到高頻數據)
(一)數據初始化操作:
(二) 統計出911數據中不同月份電話次數
(三)可視化分析——畫圖
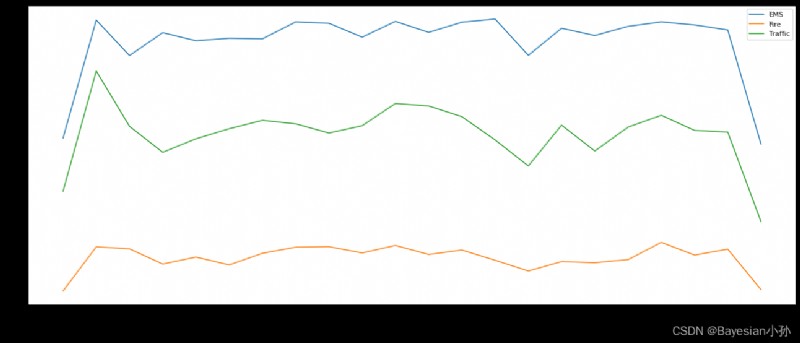
拓展練習——911數據中不同月份不同類型的電話的次數的變化情況
關於PM2.5的Demo
現在我們有2015到2017年25萬條911的緊急電話的數據,請統計出這些數據中不同類型的緊急情況的次數,如果我們還想統計出不同月份不同類型緊急電話的次數的變化情況,應該怎麼做呢?
數據來源:https://www.kaggle.com/mchirico/montcoalert/data
首先,導入一些基礎的數據分析包,讀取數據信息,查看數據head和info()
import pandas as pd
import numpy as np
from matplotlib import pyplot as plt
df = pd.read_csv("./911.csv")
print(df.head(3))
print(df.info())
>>> df.head()
lat lng desc \
0 40.297876 -75.581294 REINDEER CT & DEAD END; NEW HANOVER; Station ...
1 40.258061 -75.264680 BRIAR PATH & WHITEMARSH LN; HATFIELD TOWNSHIP...
2 40.121182 -75.351975 HAWS AVE; NORRISTOWN; 2015-12-10 @ 14:39:21-St...
zip title timeStamp twp \
0 19525.0 EMS: BACK PAINS/INJURY 2015-12-10 17:10:52 NEW HANOVER
1 19446.0 EMS: DIABETIC EMERGENCY 2015-12-10 17:29:21 HATFIELD TOWNSHIP
2 19401.0 Fire: GAS-ODOR/LEAK 2015-12-10 14:39:21 NORRISTOWN
addr e
0 REINDEER CT & DEAD END 1
1 BRIAR PATH & WHITEMARSH LN 1
2 HAWS AVE 1
>>> df.info()
<class 'pandas.core.frame.DataFrame'>
RangeIndex: 249737 entries, 0 to 249736
Data columns (total 9 columns):
# Column Non-Null Count Dtype
--- ------ -------------- -----
0 lat 249737 non-null float64
1 lng 249737 non-null float64
2 desc 249737 non-null object
3 zip 219391 non-null float64
4 title 249737 non-null object
5 timeStamp 249737 non-null object
6 twp 249644 non-null object
7 addr 249737 non-null object
8 e 249737 non-null int64
dtypes: float64(3), int64(1), object(5)
memory usage: 17.1+ MB我們需要將title裡面的內容進行切割操作,提取出[EMS,Fire,Traffic]的內容。
data_1 = df["title"].str.split(":").tolist()
data_1[0:5]
>>>
[['EMS', ' BACK PAINS/INJURY'],
['EMS', ' DIABETIC EMERGENCY'],
['Fire', ' GAS-ODOR/LEAK'],
['EMS', ' CARDIAC EMERGENCY'],
['EMS', ' DIZZINESS']]
接下來我我們提取data_1中category的信息。
cate_list = list(set(i[0] for i in data_1))
cate_list
>>>
['Fire', 'EMS', 'Traffic']
這個時候我們有幾種方法來統計出不同類型的緊急情況的次數。
zeros_df = pd.DataFrame(np.zeros((df.shape[0],len(cate_list))),columns=cate_list)
for cate in cate_list:
zeros_df[cate][df["title"].str.contains(cate)] = 1
# break
print(zeros_df)
sum_ret = zeros_df.sum(axis=0)
print(sum_ret)
>>>
Fire EMS Traffic
0 0.0 1.0 0.0
1 0.0 1.0 0.0
2 1.0 0.0 0.0
3 0.0 1.0 0.0
4 0.0 1.0 0.0
... ... ... ...
249732 0.0 1.0 0.0
249733 0.0 1.0 0.0
249734 0.0 1.0 0.0
249735 1.0 0.0 0.0
249736 0.0 0.0 1.0
[249737 rows x 3 columns]
Fire 37432.0
EMS 124844.0
Traffic 87465.0
dtype: float6
然後sum一下就好了。
zeros_df.sum(axis = 0)
>>>
Fire 37432.0
EMS 124844.0
Traffic 87465.0
dtype: float64直接遍歷所有列表,這種方式相當的慢。
for i in range(df.shape[0]):
zeros_df.loc[i,data_1[i][0]] =1
pass
print(zeros_df)
>>>
Fire EMS Traffic
0 0.0 1.0 0.0
1 0.0 1.0 0.0
2 1.0 0.0 0.0
3 0.0 1.0 0.0
4 0.0 1.0 0.0
... ... ... ...
249732 0.0 1.0 0.0
249733 0.0 1.0 0.0
249734 0.0 1.0 0.0
249735 1.0 0.0 0.0
249736 0.0 0.0 1.0
[249737 rows x 3 columns]
zeros_df.sum(axis = 0)
zeros_df.sum(axis = 0)添加一列,然後groupby,最後count計數一下。
cate_list = [i[0] for i in data_1]
df["cate"] = pd.DataFrame(np.array(cate_list).reshape((df.shape[0],1)))
print(df.groupby(by="cate").count()["title"])
>>>
cate
EMS 124840
Fire 37432
Traffic 87465
Name: title, dtype: int64
問題描述二:統計不同月份,不同類型緊急電話的變化情況。
這個就涉及到時間序列分析。
在pandas中處理時間序列是非常簡單的
pd.date_range(start=None, end=None, periods=None, freq='D')
start和end以及freq配合能夠生成start和end范圍內以頻率freq的一組時間索引
start和periods以及freq配合能夠生成從start開始的頻率為freq的periods個時間索引
four parameters: start, end, periods, and freq, exactly three must be specified
四個參數,必須要至少指定其中的三個。
import pandas as pd
pd.date_range(start="20170909",end = "20180908",freq = "M")
>>>
DatetimeIndex(['2017-09-30', '2017-10-31', '2017-11-30', '2017-12-31',
'2018-01-31', '2018-02-28', '2018-03-31', '2018-04-30',
'2018-05-31', '2018-06-30', '2018-07-31', '2018-08-31'],
dtype='datetime64[ns]', freq='M')
pd.date_range(start="20170909",periods = 5,freq = "D")
>>>
DatetimeIndex(['2017-09-09', '2017-09-10', '2017-09-11', '2017-09-12',
'2017-09-13'],
dtype='datetime64[ns]', freq='D')
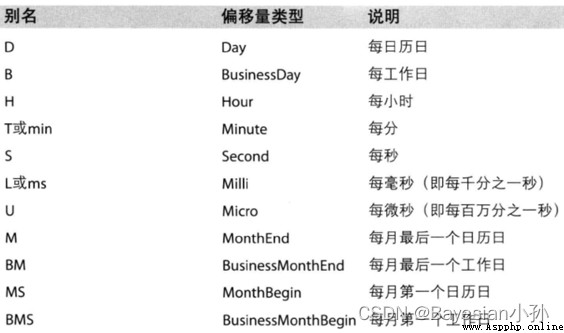
freq:就是時間出現的頻率。
關於頻率的更多縮寫
import numpy as np
index=pd.date_range("20170101",periods=10)
df = pd.DataFrame(np.random.rand(10),index=index)
df
>>>
0
2017-01-01 0.090949
2017-01-02 0.996337
2017-01-03 0.737334
2017-01-04 0.405381
2017-01-05 0.743721
2017-01-06 0.681303
2017-01-07 0.606283
2017-01-08 0.917397
2017-01-09 0.167316
2017-01-10 0.155164
回到最開始的911數據的案例中,我們可以使用pandas提供的方法把時間字符串轉化為時間序列
df["timeStamp"] = pd.to_datetime(df["timeStamp"],format="")format參數大部分情況下可以不用寫,但是對於pandas無法格式化的時間字符串,我們可以使用該參數,比如包含中文。
那麼問題來了:
我們現在要統計每個月或者每個季度的次數怎麼辦呢?
重采樣:指的是將時間序列從一個頻率轉化為另一個頻率進行處理的過程,將高頻率數據轉化為低頻率數據為降采樣,低頻率轉化為高頻率為升采樣。pandas提供了一個resample的方法來幫助我們實現頻率轉化
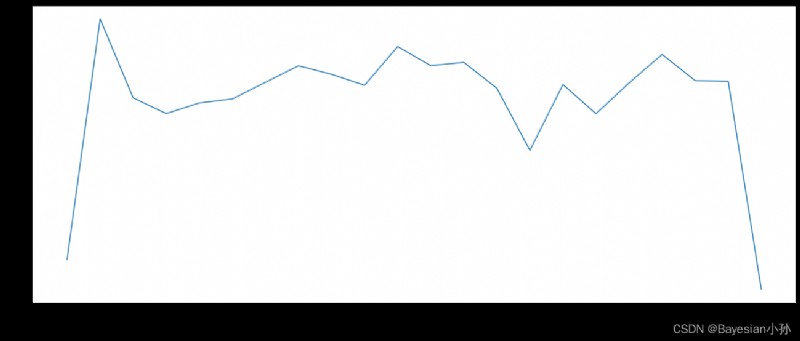
1.統計出911數據中不同月份電話次數的變化情況。
2.統計出911數據中不同月份不同類型的電話的次數的變化情況。
pandas.DataFrame.resample
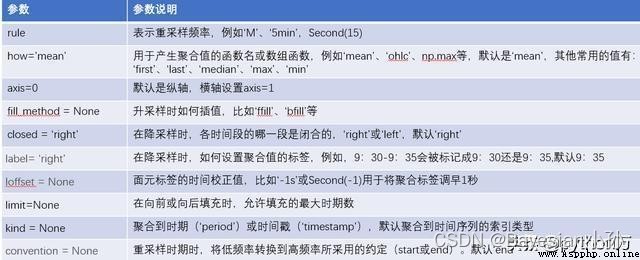
pandas.DataFrame.resample()這個函數主要是用來對時間序列做頻率轉換,函數原型如下:
DataFrame.resample(rule, how=None, axis=0, fill_method=None, closed=None, label=None, convention='start', kind=None, loffset=None, limit=None, base=0, on=None, level=None)
import pandas as pd
import numpy as np
index=pd.date_range('20190115','20190125',freq='D')
data1=pd.Series(np.arange(len(index)),index=index)
data1
>>>
2019-01-15 0
2019-01-16 1
2019-01-17 2
2019-01-18 3
2019-01-19 4
2019-01-20 5
2019-01-21 6
2019-01-22 7
2019-01-23 8
2019-01-24 9
2019-01-25 10
Freq: D, dtype: int64
data1.resample(rule='3D').sum() >>> 2019-01-15 3 2019-01-18 12 2019-01-21 21 2019-01-24 19 Freq: 3D, dtype: int64 data1.resample(rule='3D').mean() >>> 2019-01-15 1.0 2019-01-18 4.0 2019-01-21 7.0 2019-01-24 9.5 Freq: 3D, dtype: float64
label這個參數控制了分組後聚合標簽的取值。在label為right的情況下,將取分箱右側的值作為新的標簽。
上面演示了降采樣的過程,下面我們演示升采樣的過程,根據升采樣的定義,我們只需在resample函數中改變頻率即可,但與降采樣不同的是升采樣後新增頻率的數為空值,為此resample也提供了3種方式進行填充,下面我們通過代碼來演示:
三種填充方式分別為:
ffill(取前面的值)
bfill(取後面的值)
interpolate(線性取值)
data1.resample(rule='12H').asfreq()
>>>
2019-01-15 00:00:00 0.0
2019-01-15 12:00:00 NaN
2019-01-16 00:00:00 1.0
2019-01-16 12:00:00 NaN
2019-01-17 00:00:00 2.0
2019-01-17 12:00:00 NaN
2019-01-18 00:00:00 3.0
2019-01-18 12:00:00 NaN
2019-01-19 00:00:00 4.0
2019-01-19 12:00:00 NaN
2019-01-20 00:00:00 5.0
2019-01-20 12:00:00 NaN
2019-01-21 00:00:00 6.0
2019-01-21 12:00:00 NaN
2019-01-22 00:00:00 7.0
2019-01-22 12:00:00 NaN
2019-01-23 00:00:00 8.0
2019-01-23 12:00:00 NaN
2019-01-24 00:00:00 9.0
2019-01-24 12:00:00 NaN
2019-01-25 00:00:00 10.0
Freq: 12H, dtype: float64
將原來的按日的數據進行升采樣為6小時時,會產生很多空值,對於這種空值resample提供了3種方式,分別為ffill(取前面的值)、bfill(取後面的值)、interpolate(線性取值),這裡我們分別進行測試,如下:
(1)在ffill中不傳入任何參數的時候,所有的NAN被填充了,這裡我們可以輸入個數,從而指定要填充的空值個數。
data1.resample(rule='12H').ffill()
# 前向填充,取NAN前面的值來進行填充
2019-01-15 00:00:00 0
2019-01-15 12:00:00 0
2019-01-16 00:00:00 1
2019-01-16 12:00:00 1
2019-01-17 00:00:00 2
2019-01-17 12:00:00 2
2019-01-18 00:00:00 3
2019-01-18 12:00:00 3
2019-01-19 00:00:00 4
2019-01-19 12:00:00 4
2019-01-20 00:00:00 5
2019-01-20 12:00:00 5
2019-01-21 00:00:00 6
2019-01-21 12:00:00 6
2019-01-22 00:00:00 7
2019-01-22 12:00:00 7
2019-01-23 00:00:00 8
2019-01-23 12:00:00 8
2019-01-24 00:00:00 9
2019-01-24 12:00:00 9
2019-01-25 00:00:00 10
Freq: 12H, dtype: int64
data1.resample(rule='12H').ffill(2)
>>>
2019-01-15 00:00:00 0
2019-01-15 12:00:00 1
2019-01-16 00:00:00 1
2019-01-16 12:00:00 2
2019-01-17 00:00:00 2
2019-01-17 12:00:00 3
2019-01-18 00:00:00 3
2019-01-18 12:00:00 4
2019-01-19 00:00:00 4
2019-01-19 12:00:00 5
2019-01-20 00:00:00 5
2019-01-20 12:00:00 6
2019-01-21 00:00:00 6
2019-01-21 12:00:00 7
2019-01-22 00:00:00 7
2019-01-22 12:00:00 8
2019-01-23 00:00:00 8
2019-01-23 12:00:00 9
2019-01-24 00:00:00 9
2019-01-24 12:00:00 10
2019-01-25 00:00:00 10
Freq: 12H, dtype: int64
data1.resample(rule='12H').bfill()
>>>
2019-01-15 00:00:00 0
2019-01-15 12:00:00 1
2019-01-16 00:00:00 1
2019-01-16 12:00:00 2
2019-01-17 00:00:00 2
2019-01-17 12:00:00 3
2019-01-18 00:00:00 3
2019-01-18 12:00:00 4
2019-01-19 00:00:00 4
2019-01-19 12:00:00 5
2019-01-20 00:00:00 5
2019-01-20 12:00:00 6
2019-01-21 00:00:00 6
2019-01-21 12:00:00 7
2019-01-22 00:00:00 7
2019-01-22 12:00:00 8
2019-01-23 00:00:00 8
2019-01-23 12:00:00 9
2019-01-24 00:00:00 9
2019-01-24 12:00:00 10
2019-01-25 00:00:00 10
Freq: 12H, dtype: int64
data1.resample(rule='12H').interpolate()
# 線性填充
>>>
2019-01-15 00:00:00 0.0
2019-01-15 12:00:00 0.5
2019-01-16 00:00:00 1.0
2019-01-16 12:00:00 1.5
2019-01-17 00:00:00 2.0
2019-01-17 12:00:00 2.5
2019-01-18 00:00:00 3.0
2019-01-18 12:00:00 3.5
2019-01-19 00:00:00 4.0
2019-01-19 12:00:00 4.5
2019-01-20 00:00:00 5.0
2019-01-20 12:00:00 5.5
2019-01-21 00:00:00 6.0
2019-01-21 12:00:00 6.5
2019-01-22 00:00:00 7.0
2019-01-22 12:00:00 7.5
2019-01-23 00:00:00 8.0
2019-01-23 12:00:00 8.5
2019-01-24 00:00:00 9.0
2019-01-24 12:00:00 9.5
2019-01-25 00:00:00 10.0
Freq: 12H, dtype: float64
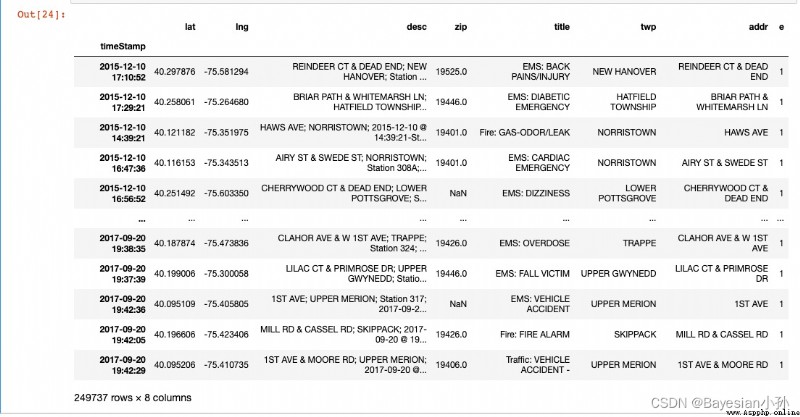
將原始數據的索引設置為時間索引值,進行如下操作。
import pandas as pd
import numpy as np
from matplotlib import pyplot as plt
df = pd.read_csv("./911.csv")
df["timeStamp"] = pd.to_datetime(df["timeStamp"])
df.set_index("timeStamp",inplace=True)
df
>>>
count_by_month = df.resample("M").count()["title"]
print(count_by_month)
>>>
timeStamp
2015-12-31 7916
2016-01-31 13096
2016-02-29 11396
2016-03-31 11059
2016-04-30 11287
2016-05-31 11374
2016-06-30 11732
2016-07-31 12088
2016-08-31 11904
2016-09-30 11669
2016-10-31 12502
2016-11-30 12091
2016-12-31 12162
2017-01-31 11605
2017-02-28 10267
2017-03-31 11684
2017-04-30 11056
2017-05-31 11719
2017-06-30 12333
2017-07-31 11768
2017-08-31 11753
2017-09-30 7276
Freq: M, Name: title, dtype: int64
#畫圖
_x = count_by_month.index
_y = count_by_month.values
_x = [i.strftime("%Y%m%d") for i in _x]
plt.figure(figsize=(20,8),dpi=80)
plt.plot(range(len(_x)),_y)
plt.xticks(range(len(_x)),_x,rotation=45)
plt.show()
import pandas as pd
import numpy as np
from matplotlib import pyplot as plt
#把時間字符串轉為時間類型設置為索引
df = pd.read_csv("./911.csv")
df["timeStamp"] = pd.to_datetime(df["timeStamp"])
#添加列,表示分類
temp_list = df["title"].str.split(": ").tolist()
cate_list = [i[0] for i in temp_list]
# print(np.array(cate_list).reshape((df.shape[0],1)))
df["cate"] = pd.DataFrame(np.array(cate_list).reshape((df.shape[0],1)))
df.set_index("timeStamp",inplace=True)
print(df.head(1))
plt.figure(figsize=(20, 8), dpi=80)
#分組
for group_name,group_data in df.groupby(by="cate"):
#對不同的分類都進行繪圖
count_by_month = group_data.resample("M").count()["title"]
# 畫圖
_x = count_by_month.index
print(_x)
_y = count_by_month.values
_x = [i.strftime("%Y%m%d") for i in _x]
plt.plot(range(len(_x)), _y, label=group_name)
plt.xticks(range(len(_x)), _x, rotation=45)
plt.legend(loc="best")
plt.show()
>>>
lat lng \
timeStamp
2015-12-10 17:10:52 40.297876 -75.581294
desc \
timeStamp
2015-12-10 17:10:52 REINDEER CT & DEAD END; NEW HANOVER; Station ...
zip title twp \
timeStamp
2015-12-10 17:10:52 19525.0 EMS: BACK PAINS/INJURY NEW HANOVER
addr e cate
timeStamp
2015-12-10 17:10:52 REINDEER CT & DEAD END 1 EMS
DatetimeIndex(['2015-12-31', '2016-01-31', '2016-02-29', '2016-03-31',
'2016-04-30', '2016-05-31', '2016-06-30', '2016-07-31',
'2016-08-31', '2016-09-30', '2016-10-31', '2016-11-30',
'2016-12-31', '2017-01-31', '2017-02-28', '2017-03-31',
'2017-04-30', '2017-05-31', '2017-06-30', '2017-07-31',
'2017-08-31', '2017-09-30'],
dtype='datetime64[ns]', name='timeStamp', freq='M')
# coding=utf-8
import pandas as pd
from matplotlib import pyplot as plt
file_path = "./PM2.5/BeijingPM20100101_20151231.csv"
df = pd.read_csv(file_path)
#把分開的時間字符串通過periodIndex的方法轉化為pandas的時間類型
period = pd.PeriodIndex(year=df["year"],month=df["month"],day=df["day"],hour=df["hour"],freq="H")
df["datetime"] = period
# print(df.head(10))
#把datetime 設置為索引
df.set_index("datetime",inplace=True)
#進行降采樣
df = df.resample("7D").mean()
print(df.head())
#處理缺失數據,刪除缺失數據
# print(df["PM_US Post"])
data =df["PM_US Post"]
data_china = df["PM_Nongzhanguan"]
print(data_china.head(100))
#畫圖
_x = data.index
_x = [i.strftime("%Y%m%d") for i in _x]
_x_china = [i.strftime("%Y%m%d") for i in data_china.index]
print(len(_x_china),len(_x_china))
_y = data.values
_y_china = data_china.values
plt.figure(figsize=(20,8),dpi=80)
plt.plot(range(len(_x)),_y,label="US_POST",alpha=0.7)
plt.plot(range(len(_x_china)),_y_china,label="CN_POST",alpha=0.7)
plt.xticks(range(0,len(_x_china),10),list(_x_china)[::10],rotation=45)
plt.legend(loc="best")
plt.show()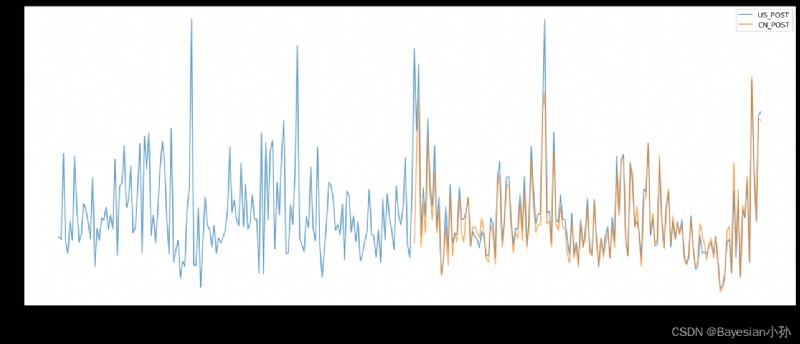
注意點:
分開的時間字符串通過periodIndex的方法轉化為pandas的時間類型
period=pd.PeriodIndex(year=df["year"],month=df["month"],day=df["day"],hour=df["hour"],freq="H")
df["datetime"] = period
關於重采樣的部分內容參考:
http://t.csdn.cn/ViZmt