#!/usr/bin/env python
# -*- coding: utf-8 -*-
# author : sunbo time : 2022/2/21 0021
import pyecharts.options as opts
from pyecharts.charts import MapGlobe
from pyecharts.faker import POPULATION
data = [x for _, x in POPULATION[1:]]
low,high = min(data),max(data)
c=(
MapGlobe(init_opts=opts.InitOpts())
.add_schema()
.add(
maptype="world",
series_name="World Population",
data_pair=POPULATION[1:],
is_map_symbol_show=False,
label_opts=opts.LabelOpts(is_show=False),
)
.set_global_opts(visualmap_opts=opts.VisualMapOpts(
min_=low,
max_=high,
range_text=["max","min"],
is_calculable=True,
is_piecewise=True,
range_color=["lightskyblue","yellow","orangered"],
)
)
)
c.render('eath.html')

In order to make the earth you like , Let's introduce the meaning of key parameters in detail :
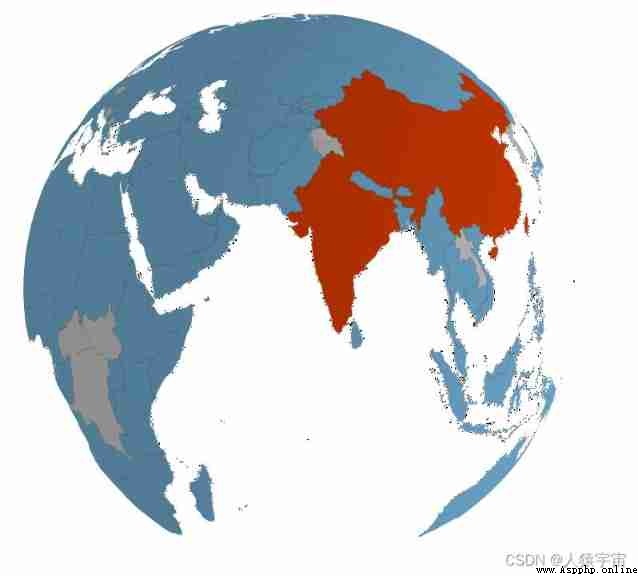
It introduces the population of all countries in the world , So the different colors on the earth represent the number of people in each country , You can also import other data as you like .
You can import different themes , The topic types are as follows :
themes = [ (‘chalk’, ‘ Chalk style ’), (‘dark’, ‘ Dark wind ’), (‘essos’, ‘ Aesop ’), (‘infographic’, ‘ Infographic ’), (‘light’, ‘ Bright style ’), (‘macarons’, ‘ Macaroon ’), (‘purple-passion’, ‘ Purple passion ’), (‘roma’, ‘ Pomegranate ’), (‘romantic’, ‘ Romantic style ’), (‘shine’, ‘ Shining wind ’), (‘vintage’, ‘ Retro style ’), (‘walden’, ‘ Walden pond ’), (‘westeros’, ‘ Westeros ’), (‘white’, ‘ Clean white wind ’), (‘wonderland’, ‘ Fairyland ’) ]
Show map labels , hold False Change to True, The name of the country is displayed .
Change the map range , hold world Change to china; Empathy , You can also make a map of the earth that only shows Beijing and other provinces and cities .