background
be based on pyecharts Thermal map with built-in longitude and latitude
Thermal map based on custom latitude and longitude
pyecharts Library shortcomings
Different map coordinate systems differ
WGS-84 - World geodetic system
GCJ-02 - Coordinates of National Survey Bureau
BD-09 - Baidu coordinate system
backgroundThe statistical analysis of business data basically involves the analysis of each province , Data visualization is a powerful tool for data analysis , The data of these provinces and regions are usually visualized with maps , Such laws can be clearly found on one side
There are many types of visualization for maps , such as : Basic geographic map 、 Heat map 、 Path map 、 Ripple diagram etc. , This article mainly introduces Heat map , The tools used are Baidu open source pyecharts
The simulation data take the popularity of national tourist attractions during the National Day holiday as an example ( Fictitious data )

Analog data
be based on pyecharts Thermal map with built-in longitude and latitudepyecharts It has the longitude and latitude of some cities , When drawing a picture, just list the cities or The name of the province , It can be displayed automatically in the map ,pyecharts According to the city or The name of the province is automatically extracted to longitude and latitude
installed pyecharts After the package , Can be in pyecharts Find the corresponding file in the package folder city_coordinates.json, It contains a large number of geographic names and longitude and latitude information
The general path is as follows :xxxxxx\Lib\site-packages\pyecharts\datasets\city_coordinates.json
The following is simulated data City 、 degree of heat Column to visualize the thermodynamic diagram
Slide left and right to see the full code
import pandas as pdfrom pyecharts import options as optsfrom pyecharts.charts import BMapfrom pyecharts.globals import BMapTypeimport jsondata=pd.read_excel(' Thermodynamic diagram simulation data .xlsx')hotmap = ( BMap(is_ignore_nonexistent_coord=True, # Ignore nonexistent coordinates init_opts=opts.InitOpts(width="1300px", height="600px")) .add_schema(baidu_ak=" I applied for key", center=[120.13066322374, 30.240018034923], zoom=5, # The zoom of the current view is_roam=True # Whether to turn on mouse zoom and pan roaming ) .add( " degree of heat ", # legend data_pair=[list(z) for z in zip(data[' City '].to_list(), data[' degree of heat '].to_list())], type_="heatmap", label_opts=opts.LabelOpts(formatter="{b}"), ) .set_global_opts( title_opts=opts.TitleOpts(title=" During the National Day holiday, the number of tourist attractions in the country is high ", pos_left='center', title_textstyle_opts=opts.TextStyleOpts(font_size=32) ), legend_opts=opts.LegendOpts(pos_right='20%'), visualmap_opts=opts.VisualMapOpts() ) .add_control_panel( copyright_control_opts=opts.BMapCopyrightTypeOpts(position=3), maptype_control_opts=opts.BMapTypeControlOpts( type_=BMapType.MAPTYPE_CONTROL_DROPDOWN ), scale_control_opts=opts.BMapScaleControlOpts(), overview_map_opts=opts.BMapOverviewMapControlOpts(is_open=True), navigation_control_opts=opts.BMapNavigationControlOpts(), geo_location_control_opts=opts.BMapGeoLocationControlOpts(), ) .render(" be based on pyecharts Thermal map with built-in longitude and latitude .html"))#hotmap.render_notebook()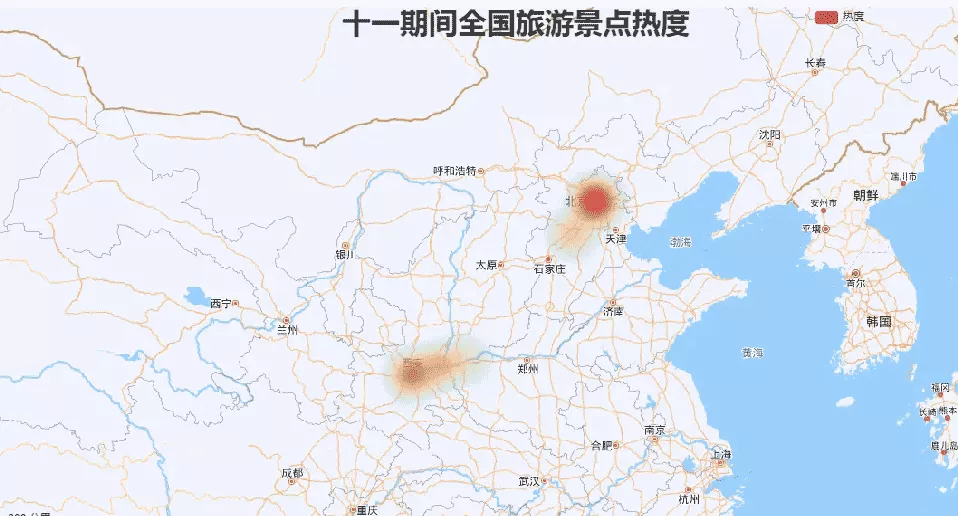
Built in latitude and longitude
Thermal map based on custom latitude and longitude because pyecharts Medium city_coordinates.json What is stored inside are some commonly used geographical longitude and latitude , If you want to use custom latitude and longitude ,pyecharts Also supportive
The following is simulated data longitude 、 dimension 、 degree of heat Column to visualize the thermodynamic diagram
import pandas as pdfrom pyecharts import options as optsfrom pyecharts.charts import BMapfrom pyecharts.globals import BMapTypeimport jsondata=pd.read_excel(' Thermodynamic diagram simulation data .xlsx')data_json={}for index,row in data.iterrows(): data_json[row[' Place names ']]=[float(row[' longitude ']),float(row[' dimension '])]with open("BMAP.json","w") as f: json.dump(data_json,f)hotmap = ( BMap(is_ignore_nonexistent_coord=True, # Ignore nonexistent coordinates init_opts=opts.InitOpts(width="1300px", height="600px")) .add_schema(baidu_ak=" I applied for key", center=[120.13066322374, 30.240018034923], zoom=5, # The zoom of the current view is_roam=True # Whether to turn on mouse zoom and pan roaming ) .add_coordinate_json("BMAP.json") # Load custom coordinates .add( " degree of heat ", # legend data_pair=[list(z) for z in zip(data[' Place names '].to_list(), data[' degree of heat '].to_list())], type_="heatmap", label_opts=opts.LabelOpts(formatter="{b}"), ) .set_global_opts( title_opts=opts.TitleOpts(title=" During the National Day holiday, the number of tourist attractions in the country is high ", pos_left='center', title_textstyle_opts=opts.TextStyleOpts(font_size=32) ), legend_opts=opts.LegendOpts(pos_right='20%'), visualmap_opts=opts.VisualMapOpts(max_=20) # Set maximum , The purpose is to accurately view the self-determined coordinate position ) .add_control_panel( copyright_control_opts=opts.BMapCopyrightTypeOpts(position=3), maptype_control_opts=opts.BMapTypeControlOpts( type_=BMapType.MAPTYPE_CONTROL_DROPDOWN ), scale_control_opts=opts.BMapScaleControlOpts(), overview_map_opts=opts.BMapOverviewMapControlOpts(is_open=True), navigation_control_opts=opts.BMapNavigationControlOpts(), geo_location_control_opts=opts.BMapGeoLocationControlOpts(), ) .render(" Thermal map based on custom latitude and longitude .html"))#hotmap.render_notebook()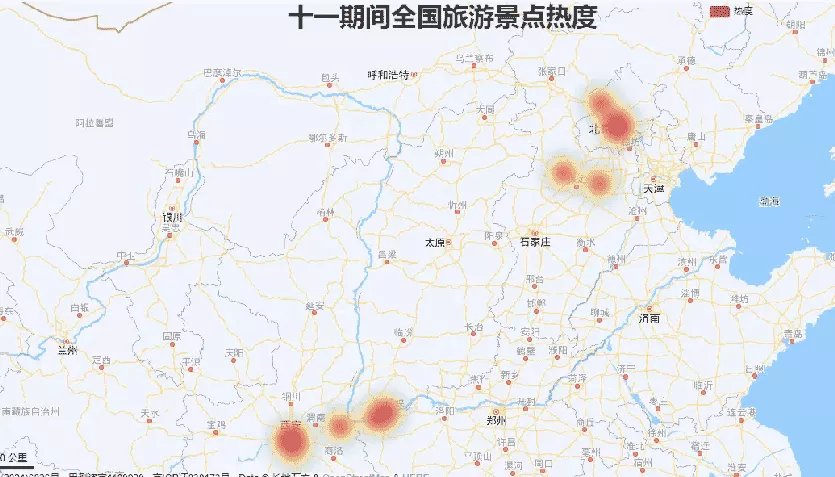
Custom latitude and longitude
pyecharts Library shortcomings There is no ready-made way to import custom coordinates directly , You need to write the custom coordinates in json In file , And then import by loading the file , There is no way to import custom coordinates directly , This can be seen from the source code , If there is a add_coordinate_dict Function is perfect
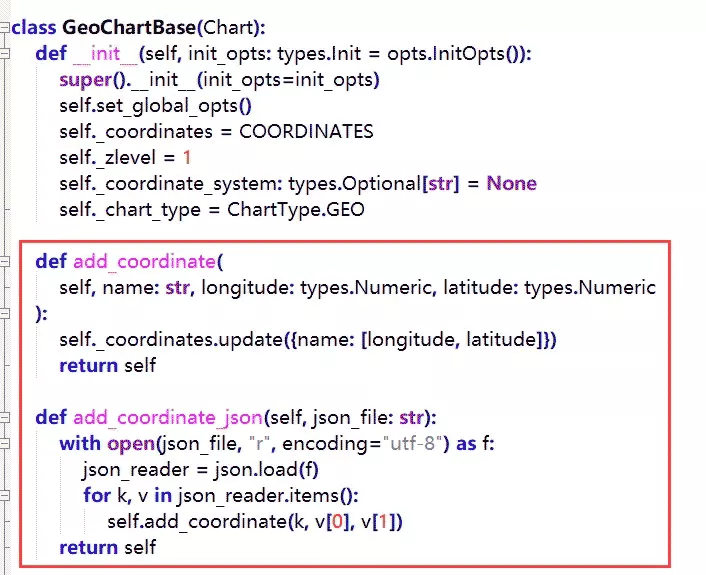
shortcoming
Different map coordinate systems differWe usually use latitude and longitude to represent a geographical location , But for some reason , The latitude and longitude information we get from different channels may not be in the same coordinate system .
Gould map 、 Tencent map and Google China map use GCJ-02 Coordinate system
Baidu map uses BD-09 Coordinate system
Bottom interface (HTML5 Geolocation or ios、 Android API) adopt GPS The coordinates acquired by the device use WGS-84 Coordinate system
There may be tens to hundreds of meters of offset between different coordinate systems , So developing a map based product , Or when doing geographic data visualization , We need to correct the deviation between different coordinate systems .
WGS-84 - World geodetic systemWGS-84(World Geodetic System, WGS) It's the most widely used coordinate system , It's also a universal coordinate system ,GPS The latitude and longitude obtained by the device is in WGS84 Latitude and longitude in a coordinate system . Usually, the location information obtained through the underlying interface is WGS84 Coordinate system
GCJ-02 - Coordinates of National Survey BureauGCJ-02(G-Guojia Country ,C-Cehui Mapping ,J-Ju game ), Also known as the Martian coordinate system , It's based on WGS-84 The geodetic system developed , Formulated by China National Bureau of Surveying and mapping . The confusion algorithm used in this coordinate system will add random offset in longitude and latitude .
State regulations , All open geographic data in Chinese Mainland need at least GCJ-02 To encrypt , In other words, the data we get from the products of domestic companies , It must be encrypted . Most domestic Internet map providers use GCJ-02 Coordinate system , Including the Gaud map , Google maps China, etc .
BD-09 - Baidu coordinate systemBD-09(Baidu, BD) It's the geographic coordinate system used by Baidu map , Its presence GCJ-02 One more transformation is added to the , To protect user privacy . The coordinates obtained from Baidu products are BD-09 Coordinate system
That's all Python pyecharts Real time drawing custom visual longitude and latitude thermal map details , More about Python pyecharts For information about real-time drawing, please pay attention to other relevant articles on the software development network !