Python Office automation is mainly mass production 、 automation 、 Customized solution to data problems , At present, it is mainly divided into three parts : automation office、 Automated robots 、 Automated data services .
1、 automation office, Including yes excel、word、ppt、email、pdf And other common office scenes ,
python There are corresponding tool Libraries , It's easy to call .
Provide some common core libraries for your reference .
excel:xlwings、xlrd、xlwt、openpyxl
word:Python-docx
ppt: pptx
email:smtplib(SMTP service )、email( Parsing )、yagmail( The universal )
pdf: pypdf2、pdfminer、pdfplumbe
picture: PIL
Learn these skills python It's the premise , For Xiaobai, self-study is not easy , It takes quite a while to get used to python The grammatical logic of , And insist on typing the code yourself , Keep practicing .
2、 Automated robots , Used to improve routine and high-frequency Services , For example, wechat customer service 、 Automatic trading system 、 Real time information capture 、QQ Chat robots, etc .
for example
web automated testing : selenium
Analog mouse and keyboard : pymouse、pywinauto、pyautogui
Wechat Automation : wechatby
Python Office automation is actually not difficult , But there needs to be Python Basics , At least you have to be able to write scripts , Otherwise, although there is an automatic interface, it won't work .
Many people have been in the door for a long time , Still wandering outside the door , I think it's a question of learning methods . Learning programming must practice more , Basics + Go with the actual combat , Only in this way can we master Python.
Maybe you'll ask , What if you can't read , Then go another way , You can watch the video 、 Watch online tutorials 、 Stroll github, Are very good methods .
3、 Automated data services , It mainly provides streaming data services , Get from data 、 Data processing 、 Data modeling 、 Data visualization , To finally generate the data report , adopt python Build a complete data chain .
Data capture : requests、scrapy
Data processing : pandas、numpy
Data modeling : scipy、scikit-learn、statesmodel、keras
Data visualization :matplotlib、seaborn、bokeh、pyecharts
Data reports : dash
With python operation excel For example , Use xlwings Generate automated charts .
1、 Brief introduction xlwings
Next, practice :
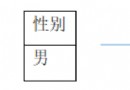
1、 Prepare a form
2、 Perform various operations on the table
Import xlwings library , Name it xw
import xlwings as xw
Establish a connection to the active workbook
# Use here books Method , Reference workbooks
wb = xw.books[" List of goods .xlsx"]
type(wb)
xlwings.main.Book
View the name of the workbook
wb.name
' List of goods .xlsx'
Instantiate the worksheet object
sht = wb.sheets[' Table 1 ']
See Table 1 A1 Cell contents
# Standard usage
sht.range('A1').value
' category '
# Concise usage
sht['A1'].value
' category '
# Index usage
sht[0,0].value
' category '
sht.range('A1:D8').valueOutput :
[[' category ', ' Number ( Pieces of )', ' The unit price ( element )', ' The total price ( element )'],
[' nuts ', 5.0, 30.0, 150.0],
[' can ', 9.0, 10.0, 90.0],
[' beef ', 3.0, 60.0, 180.0],
[' Fruit juice ', 10.0, 9.0, 90.0],
[' honey ', 2.0, 80.0, 160.0],
[' Imported snacks ', 4.0, 70.0, 280.0],
[' total ', 33.0, 43.166666666666664, 950.0]]
sht[:8,:4].value
Output :
[[' category ', ' Number ( Pieces of )', ' The unit price ( element )', ' The total price ( element )'],
[' nuts ', 5.0, 30.0, 150.0],
[' can ', 9.0, 10.0, 90.0],
[' beef ', 3.0, 60.0, 180.0],
[' Fruit juice ', 10.0, 9.0, 90.0],
[' honey ', 2.0, 80.0, 160.0],
[' Imported snacks ', 4.0, 70.0, 280.0],
[' total ', 33.0, 43.166666666666664, 950.0]]
Put table 1 B2 Cell 5 Change it to 7
sht.range('B2').value = 7First step : Connect Table 2
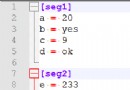
The second step : Generate a dataframe Type dataset
The third step : Import table 2
sht_2 = wb.sheets[' Table two ']
import pandas as pd
df = pd.DataFrame({' full name ':[' Xiao Wang ',' Xiao Zhang ',' petty thief '],' Age ':[23,26,19]})
df
Import :
sht_2.range('B1').value = dfImport... Into table 2 numpy Array
import numpy as np
obj = np.array([[1,2,3],[4,5,6]])
obj
Output :
array([[1, 2, 3],
[4, 5, 6]])
Import :
sht_2.range('F1').value = objtake excel The data is exported to DataFrame Format
sht_2.range('B1').options(pd.DataFrame, expand='table').valueuse matplotlib Draw and paste the picture to excel On
import matplotlib.pyplot as plt
fig = plt.figure(figsize=(4,4))
plt.plot([1,2,3,4,5])
sht_2.pictures.add(fig, name='MyPlot', update=True)
Output :
<Picture 'MyPlot' in <Sheet [ List of goods .xlsx] Table two >>
Modify table 3 A1 The width and height of the cell
Connect Table 3
sht_3 = wb.sheets[' Table 3 ']
see A1 The width and height of the cell
# View column width
sht_3.range('A1').column_width
8.11
# View row height
sht_3.range('A1').row_height
13.8
A1 Change the cell height to 15.6, Change the width to 2.2
sht_3.range('A1').column_width = 2.2
sht_3.range('A1').row_height = 15.6
Amend table III B1 Cell color
# see B1 Cell color
sht_3.range('B1').colo
(255, 0, 0)
# modify B1 The cell color is black
sht_3.range('B1').color = (0,0,0)
Write an automated script
def f():
sht_3.range("A1:AZ48").column_width = 1.1
sht_3.range('A1:AZ48').row_height = 7.8
list_1 = pd.read_csv('zaike.csv').values
for i,j in list_1:
sht_3[int(i),int(j)].color = (255,25,0)
f()
list_1 = []
for i in range(30):
for j in range(40):
c = sht_3[i,j].colo
if c == (255,0,0):
list_1.append((i,j))
These small examples can run , You can run it on your computer , Or hand tap each code , In this way, we can master .
If the python I'm not familiar with grammar yet , It's best to familiarize yourself with the framework first , Do more practice .
Today's sharing is here ~