Hello everyone , Today I'd like to talk about Python The content of the comprehensive actual combat drill —— Take the popular hot pot as an example , How to use what we have Python Language , Go to get the number of hot pot shops in different cities across the country , And visually display these data ?
Next, I will take you to realize this operation , Based on a certain degree of map data , adopt Python Technical knowledge to obtain data and visualize . It presents a more intuitive way to browse different provinces in the country 、 Distribution of hot pot shops in different cities .
First, let's look at the data source , In a certain degree of map, follow the operation below , You can ask for information about hotpot shops all over the country ( From the following figure, it doesn't show , But by Network, You can see the data )
stay network in , Find the following packet
When you open it, you can see json data
After analyzing the web page , Next, you can use Python Technology to obtain data , And save to excel in .
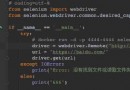
import json
import requests
import openpyxl</pre>
Let's start writing the request data code ( Remember to bring headers)
### Request header headers = { "User-Agent": "Mozilla/5.0 (Windows NT 10.0; Win64; x64)
AppleWebKit/537.36 (KHTML, like Gecko) Chrome/89.0.4389.90 Safari/537.36", 'Referer':'https://map.baidu.com/@12949550.923158279,3712445.9716704674,6.28z', "Cookie":";" Yours cookie",}
## Request link url = "https://map.baidu.com/?newmap=1&reqflag=pcmap&biz=1&from=webmap&da_par=direct&pcevaname=pc4.1&qt=s&da_src=searchBox.button&wd=%E7%81%AB%E9%94%85%E5%BA%97&c=1&src=0&wd2=&pn=0&sug=0&l=6&b=(10637065.476146251,2368134.592189369;12772445.910805061,5056757.351151566)&from=webmap&biz_forward={%22scaler%22:1,%22styles%22:%22pl%22}&sug_forward=&auth=NTSwAZUMzIaTTdWD4WAv0731cWF3MQEauxLxREHzERRtykiOxAXXw1GgvPUDZYOYIZuVt1cv3uVtGccZcuVtPWv3GuztQZ3wWvUvhgMZSguxzBEHLNRTVtcEWe1GD8zv7ucvY1SGpuxVthgW1aDeuxtf0wd0vyMySFIAFM7ueh33uTtAffbDF&seckey=c6d9c7e05d7e627c56ed46fab5d7c5c792064779599d5e12b955a6f18a1204375d1588206c94d22e4bdd1ade0ad06e78c21917e24c6223b96bc51b75ca38651a1b203a0609f126163c5e82fd0549a068e537303424837ab798acfc9088e5d76a66451c20ebd9599b41c9b4f1371850d20fa442ad464712f54c912422f4fa20b3052f8bb810f30d41c7c0e55af68f9d9d973537f03d0aa0a1d1617d78cae29b49c64c2d2dc3f44cf0f8799234b124a7a2dec18bfa011e097e31a508eae37b8603f97df8f935f04b3652f190eac52d04816f302a582c53971e515ff2e0e2b4cc30446e0bee48d51c4be8b6fe4185589ed9&device_ratio=1&tn=B_NORMAL_MAP&nn=0&u_loc=12677548,2604239&ie=utf-8&t=1618452491622"
### The response data response = requests.get(url,headers=headers).json()
there cookie It can be found in the browser network Copy in .
By returning json Data can tell , Our target data is more_city in , Inside is the list data, which is the province (provice Is the name of the province ,num It's the number of hot pot shops ), Then there are... In every province city( list ), There are cities corresponding to provinces (name Is the name of the city ,num Is the number of hot pot shops in the corresponding city )
response = response['more_city']
for i in response:
city = i['city']
print(i['province'])
print(i['num'])
for j in city:
print(j['name'])
print(j['num'])
Provinces and cities are saved in two different places excel in
outwb_p = openpyxl.Workbook()
outws_p = outwb_p.create_sheet(index=0)
outws_p.cell(row=1, column=1, value=" Province ")
outws_p.cell(row=1, column=2, value=" Number ")
outwb_c = openpyxl.Workbook()
outws_c = outwb_c.create_sheet(index=0)
outws_c.cell(row=1, column=1, value=" City ")
outws_c.cell(row=1, column=2, value=" Number ")
##################
### Write data in the loop
##################
### Keep the number of hotpot in provinces all over the country - Li Yunchen ”
outwb_p.save(" The number of hot pot in provinces in China - Li Yunchen .xls") # preservation
### Keep the number of national urban hot pot - Li Yunchen ”
outwb_c.save(" Number of urban hot pot in China - Li Yunchen .xls") # preservation datafile = u' The number of hot pot in provinces in China - Li Yunchen .xls'
data = pd.read_excel(datafile)
attr = data[' Province '].tolist()
value = data[' Number '].tolist()
name = []
for i in attr:
if " province " in i:
name.append(i.replace(" province ",""))
else:
name.append(i)
from pyecharts import options as opts
from pyecharts.charts import Map
from pyecharts.faker import Faker
c = (
Map()
.add(" Number ", [list(z) for z in zip(name, value)], "china")
.set_global_opts(title_opts=opts.TitleOpts(title=" Number and distribution of hot pot shops in China "))
.render(" Number and distribution of hot pot shops in China .html")
)You can also draw like this
datafile = u' The number of hot pot in provinces in China - Li Yunchen .xls'
df = pd.read_excel(datafile)
province_distribution = df[[' Province ', ' Number ']].values.tolist()
geo = Geo()
geo.set_series_opts(label_opts=opts.LabelOpts(is_show=False))
geo.add_schema(maptype="china")
geo.set_global_opts(visualmap_opts=opts.VisualMapOpts(max_=110000))
# Add data
geo.add(' Distribution of the number of hot pot shops in China 2', province_distribution, type_=ChartType.EFFECT_SCATTER)
geo.render(" Distribution of the number of hot pot shops in China 2.html")In order to map the distribution of the city , Sichuan Province is selected as an example ( If you want to map all the cities in the country , The pictures come out like that , Not beautiful )
datafile = u' Number of urban hot pot in China - Li Yunchen .xls'
data = pd.read_excel(datafile)
city = data[' City '].tolist()
values2 = data[' Number '].tolist()
### sichuan
name = []
value = []
flag = 0
for i in range(0,len(city)):
if city[i] ==" Mianyang City ":
flag = 1
if flag:
name.append(city[i])
value.append(int(values2[i]))
if city[i] ==" Ganzi Tibetan Autonomous Prefecture ":
name.append(city[i])
value.append(int(values2[i]))
break
c = (
Map()
.add(" Number and distribution of Sichuan hotpot shops ", [list(z) for z in zip(name, value)], " sichuan ")
.set_global_opts(
title_opts=opts.TitleOpts(title=" Number and distribution of Sichuan hotpot shops "), visualmap_opts=opts.VisualMapOpts()
)
.render(" Number and distribution of Sichuan hotpot shops .html")
)The content of this article aims to make a simple example analysis of visual actual combat operation , Not much in-depth discussion . The original intention of writing this article is to attract jade , If you want to achieve real mastery , There is no doubt that deeper learning is needed . Now I've sorted out some for you Python Video reference and visual learning materials ( This is just a simple demonstration ), So that we can learn and give better play to , If you need a friend, you can send me a private letter to collect it