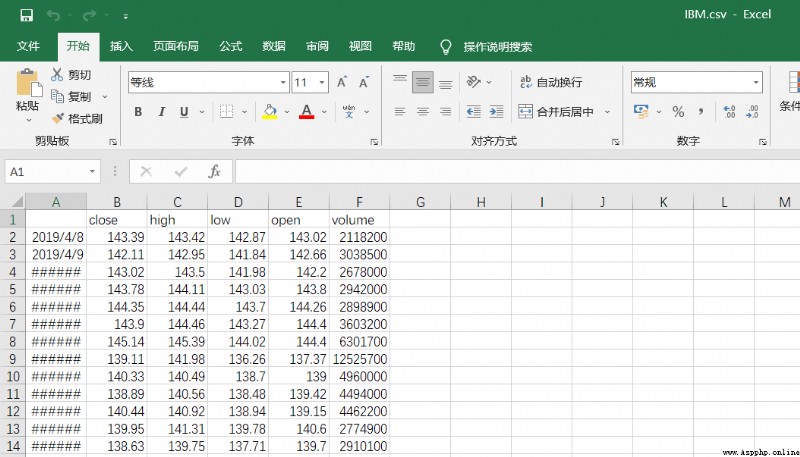
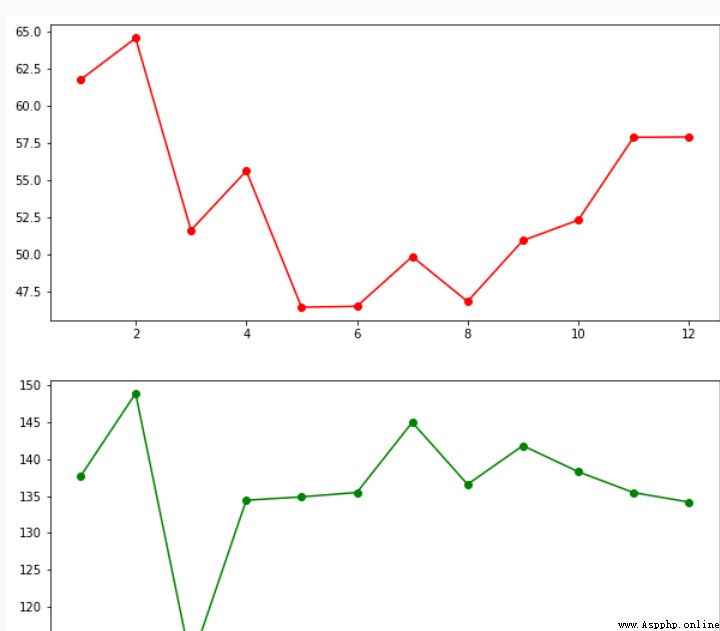
關於利用pandas\time\matplotlib庫將Intel 和 IBM 公司近一年來每個月開盤價的平均值繪制在一張圖中(用 subplot 或 subplots() 函數 )

import pandas as pd
import matplotlib.pyplot as plt
import time
def create_aveg_open(stock_code):
quotesdf_ori=pd.read_csv('step1/'+stock_code+'.csv',index_col=[0])
#請在此處補充代碼,按要求完成輸出
meanopen=quotesdf_ori.groupby('month').open.mean()return meanopen def plot():
open1 = create_aveg_open('INTC')
open2 = create_aveg_open('IBM')
plt.figure(figsize=(10,10),dpi=100)
#請在此處補充代碼,按要求完成輸出
x1=open1.indexy1=open1x2=open2.indexy2=open2plt.subplpt(211)plt.plot(x1,y1,color="r",marker="o")plt.subplpt(212)plt.plot(x1,y1,color="g",marker="o")plt.show()plt.savefig( 'step1/outfile/sub.png' )plt.close()不知道如分組月份
能夠按月份分組來顯示折線圖
