Recently, I found that many friends around me are not happy to use pandas, Switch to other data operation Libraries , As a data worker , Basically open your mouth pandas, Closed mouth pandas 了 , So I wrote this series to make more friends fall in love with pandas.
Series article description :
Series name ( Serial number of series articles )—— This series of articles specifically address the needs
platform :
Recently, I came across a very interesting... While surfing the Internet pandas Example training topic , The title has been published for a long time , Someone has already answered this question , say : There's a set of data , Each column records each index of the sample , To calculate each index of each data , Find the corresponding samples with the smallest sum of the absolute value of the index difference between each sample , Such as :a sample :[10.0, 9.0, 7.5, 8.6],b sample :[11.2, 8.7, 6.4, 5.5] The similarity between them is calculated as :|10.0-11.2|+|9.0-8.7|+|7.5-6.4|+|8.6-5.5|.
The absolute value is subtracted from the corresponding position and then added , Calculate the remaining samples for each sample , Get the least similarity of all samples 5 Other samples .
As described above , Construct a set of random data :
import numpy as np
import pandas as pd
np.random.seed(2022)
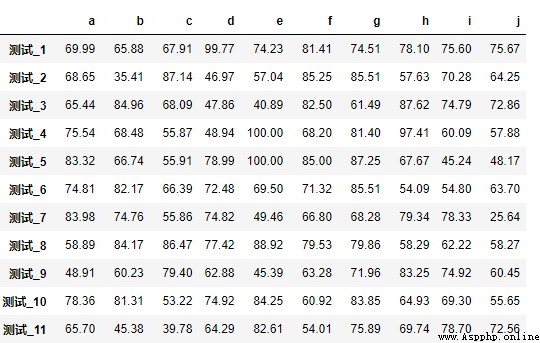
data = np.clip(np.random.normal(loc=70, scale=15, size=600).round(2), 0, 100).reshape(60, 10)
df = pd.DataFrame(data, columns=list('abcdefghij'), index=[f' test _{
i}' for i in range(1, 61)])
Data size is :60*10, Floating point type .
First, calculate the cross data of each sample , Then group to get the top in the group 5 Data .
This method is the method of the solver at the bottom of the problem , The way it uses Cartesian products is very interesting .
df = df.reset_index().rename(columns={
'index': ' name '})
# Set auxiliary columns
df['one'] = 1
# merge Oneself , With one List as key Parameter merge data frame
df_merge = pd.merge(left=df, right=df, left_on='one', right_on='one')
The original data size is 60*10, After the product is 3600 That's ok , The memory usage is much larger than that before processing , If the data is too large , In terms of processing , The time consumption will increase significantly .
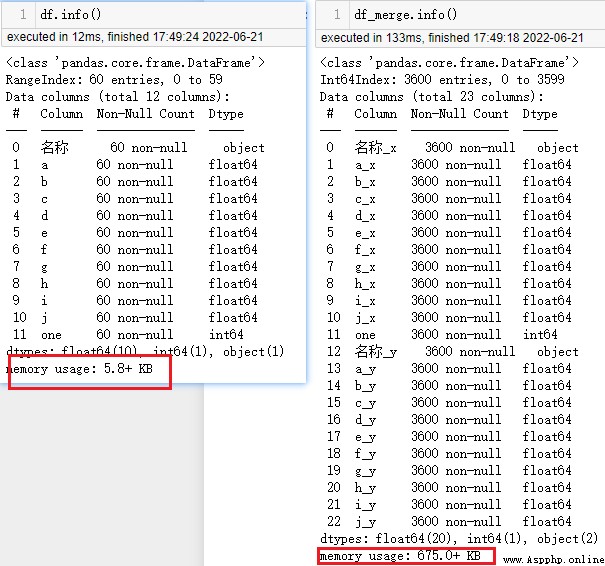
Let's not consider the impact of data volume , To continue processing .
# Remove the name column and one Column
columns = list(df.columns)
columns.remove(' name ')
columns.remove('one')
def sim_fun(row):
sim_value = 0.0
for col in columns:
sim_value += abs(round(row[col+'_x'] - row[col+'_y'], 2))
return round(sim_value, 2)
# Find the similarity between each sample
df_merge['sim'] = df_merge.apply(sim_fun, axis=1)
df_merge = df_merge[df_merge[' name _x'] != df_merge[' name _y']].copy()
# Obtain the lowest value of each sample and its similarity 5 Samples
def get_top_sims(df_sub):
df_sort = df_sub.sort_values('sim').head(5)
names = ','.join(df_sort[' name _y'])
sims = ','.join(df_sort['sim'].astype(str))
return pd.Series({
'names': names, 'sims': sims})
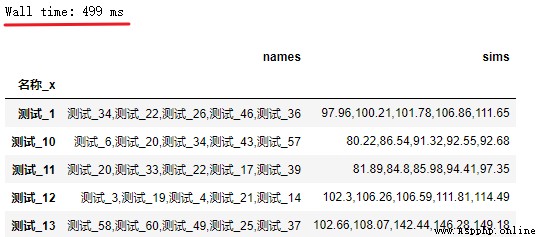
df_result = df_merge.groupby(' name _x').apply(get_top_sims)
Answer the code of the boss by repeating the above , Successfully returned the data frame with the top five similarity . You can see only 60 The Cartesian product is used in the data , It is acceptable to spend time .
In method 1, it can be noted that the data processing is slightly cumbersome , Expand the data capacity for further processing , And the difference of data is calculated one by one . Understand the data carefully , You can use the broadcast feature of the array to process .
def get_sims(s):
# Be careful : Here df Is a global variable
df_sim = (df - s).abs().sum(axis=1).round(2)
df_sim.pop(s.name)
df_sim = df_sim.sort_values(ascending=False).head(5).astype(str)
return pd.Series({
'names': ','.join(df_sim.index), 'sims': ','.join(df_sim.values)})
# apply Traverse the data by row , Make other rows calculate data with this row
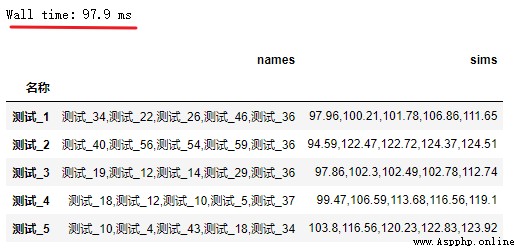
df_result = df.apply(get_sims, axis=1)
The function in method 1 is optimized to get_sims function , It also greatly improves the computational efficiency .
By understanding the purpose of the topic and the ideas of other solvers , According to what you know pandas Skill to analyze and deal with the problem , Reduce the redundancy of data calculation to a certain extent , Meet data needs , If you do not understand this article , Do your best to express your ideas .
It is much joyful to share the joy than enjoy alone. .
Made on June 21, 2002