Preface
1.loc=‘String or Number’
2.bbox_to_anchor=(num1, num2)
3. Take a chestnut :
summary
Prefacematplotlib The default position of the drawing example is in every corner of the drawing , But sometimes the legend position will block the image and do not meet our needs , The legend position needs to be adjusted . The code is as follows :
1.loc=‘String or Number’plt.legend(loc=‘String or Number’, bbox_to_anchor=(num1, num2))
This parameter is used to locate the approximate position of the legend ,string Parameters include
best ( Automatically find the best position , But sometimes it doesn't meet our expectations )
upper right( Upper right corner )
upper left ( top left corner )
lower left ( The lower left corner )
lower right ( The lower right corner )
right ( Right , and center right Same position )
center left ( Center left )
center right ( Center right )
lower center( Center down )
upper center( Above the middle )
center( precise middle )
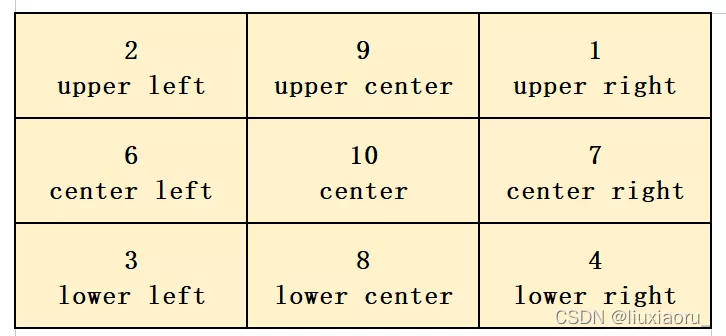
Its position in the table is as follows :
Of course, parameters can also be passed in numbers as shown in the figure .

Sometimes the first parameter alone can not meet our expectations , For example, legends are stacked together , At this time, you need to adjust the second parameter .
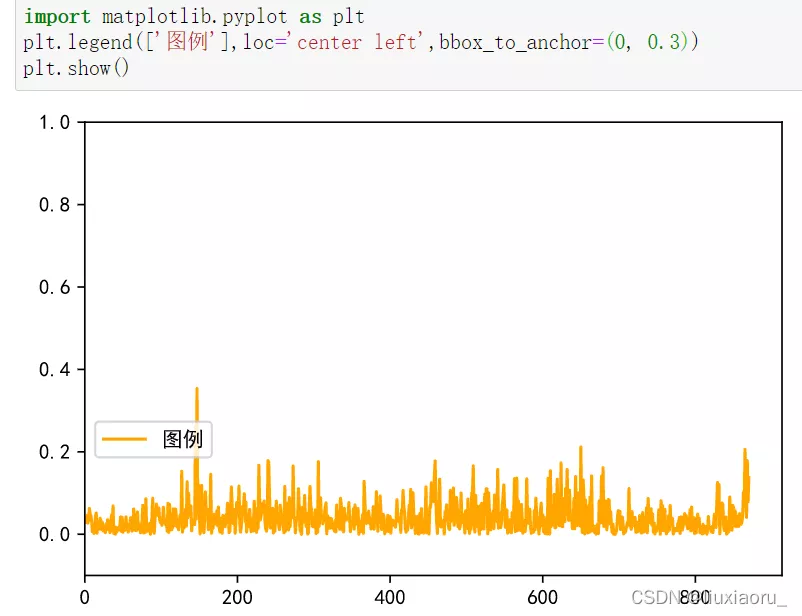
num1 Used to control the legend Moving left and right , The bigger the value is. , Move to the right ;
num2 Used to control the legend Moving up and down , The bigger the value is. , Moving up .
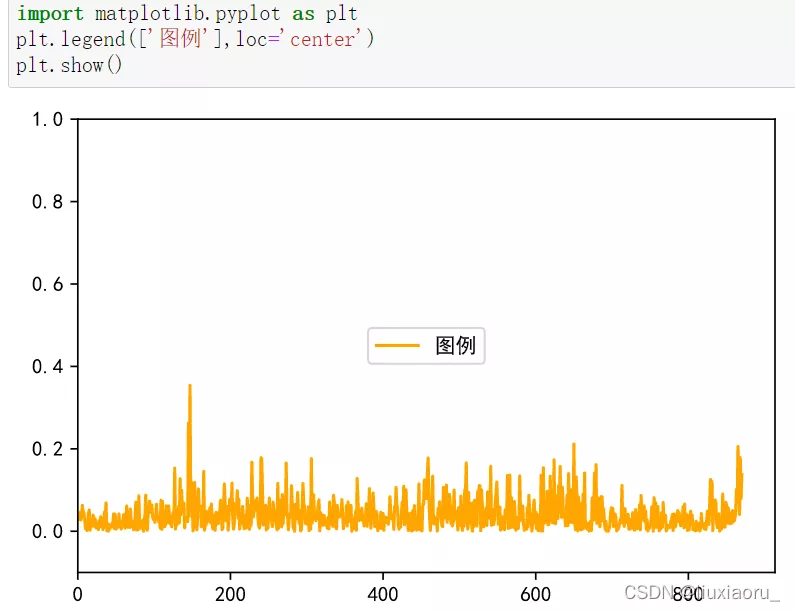
3. Take a chestnut :(1) plt.legend([‘ legend ’],loc=‘center’) or loc=10

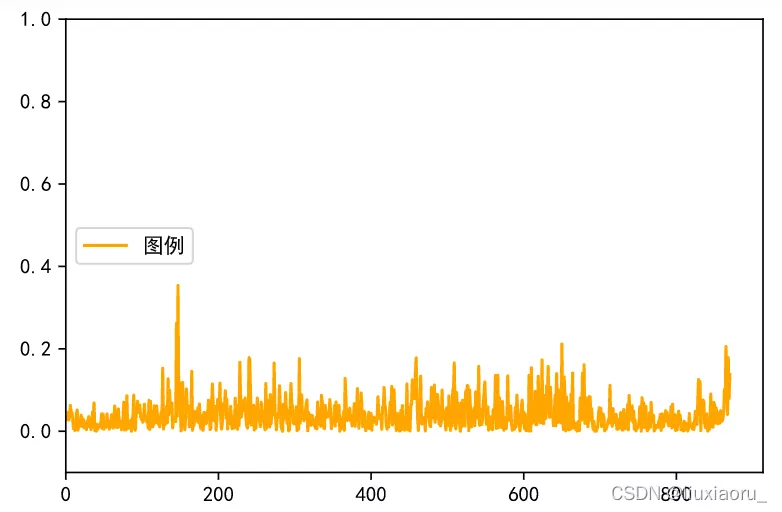
(2) plt.legend([‘ legend ’],loc=‘center left’) or loc=6

Fine tune again

This is about python in matplotlib This is the end of the article on adjusting the position of the legend , More about python matplotlib To adjust the legend position, please search the previous articles of SDN or continue to browse the relevant articles below. I hope you will support SDN more in the future !