
source :https://pandastutor.com/index.html
Pandas It is a common tool of data mining , It is very important to master the functions in the process of use . This paper will use the process of Visualization , Explain Pandas Various operations of .
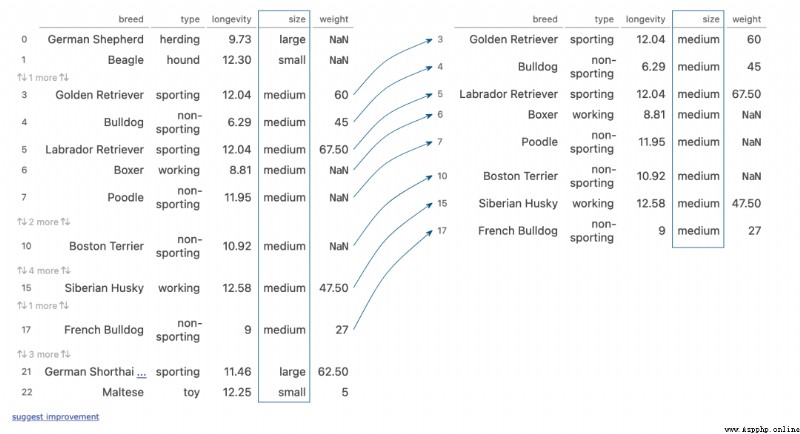
(dogs[dogs['size'] == 'medium']
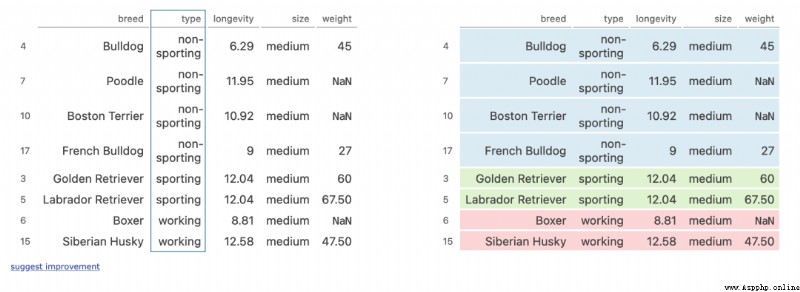
 .sort_values('type')
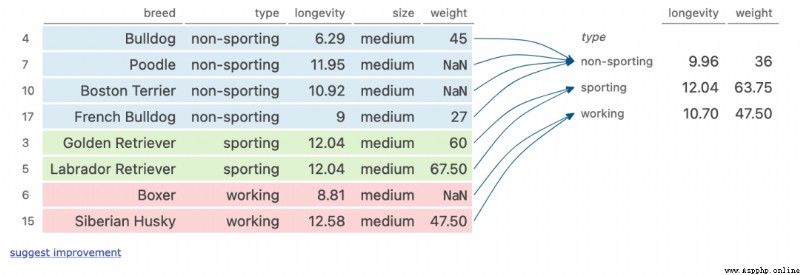
 .groupby('type').median()
)
Execution steps :
size List and filter out departments and branches
Then convert the type of the row
according to type Columns to group , Calculate the median

dogs['longevity']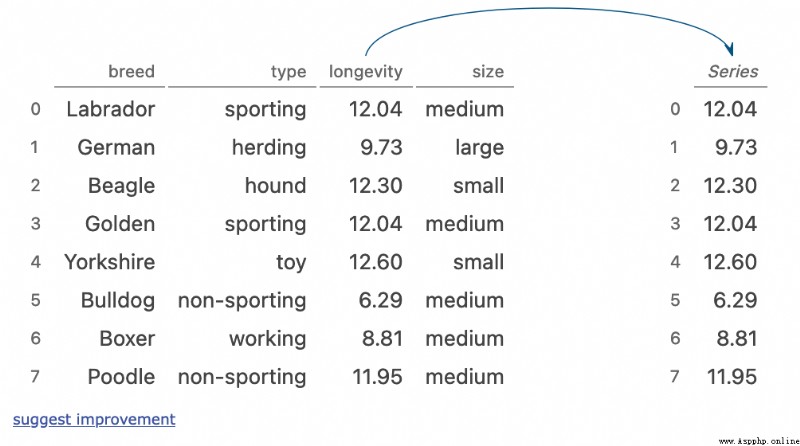
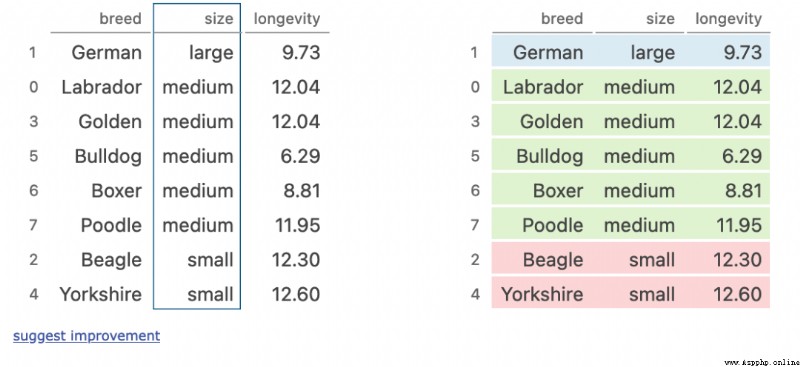
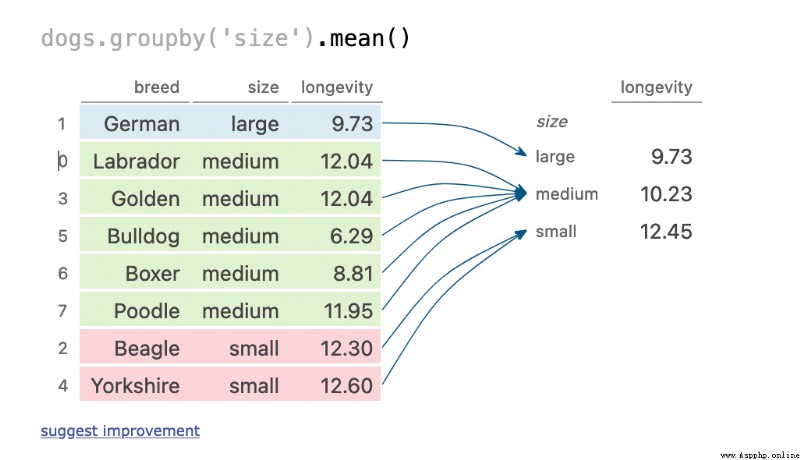
dogs.groupby('size').mean()Execution steps :
Set the data according to size Grouping
Aggregate within a group
dogs.groupby(['type', 'size'])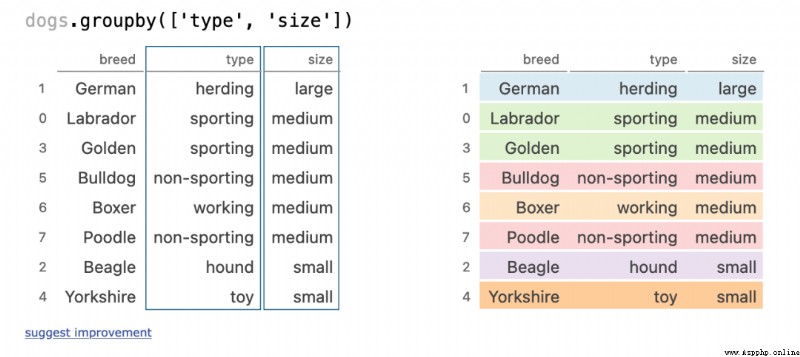
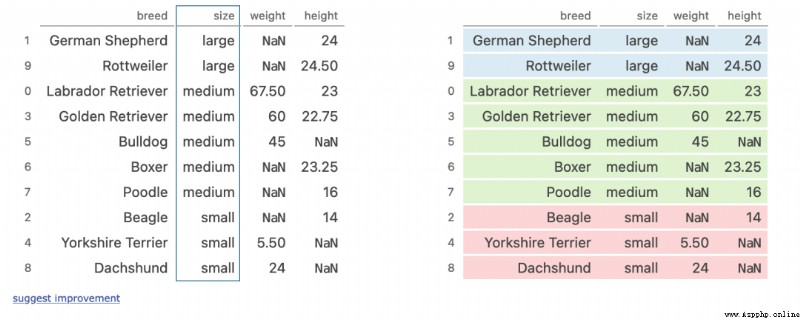
(dogs
  .sort_values('size')
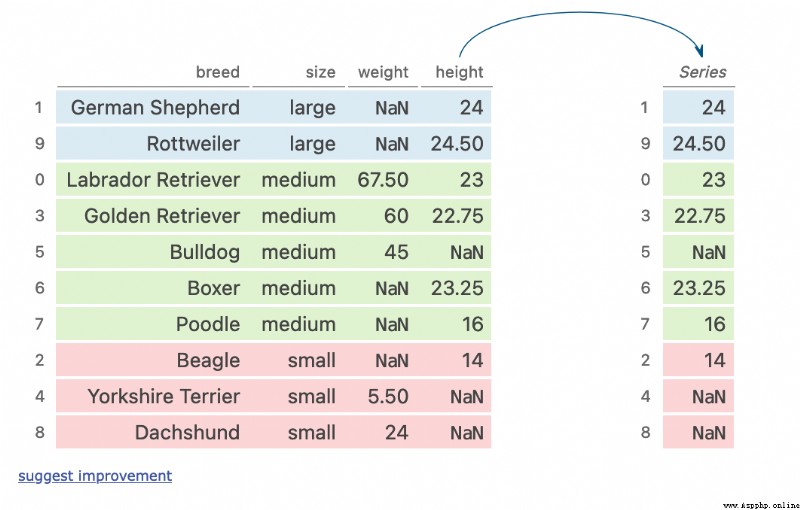
  .groupby('size')['height']
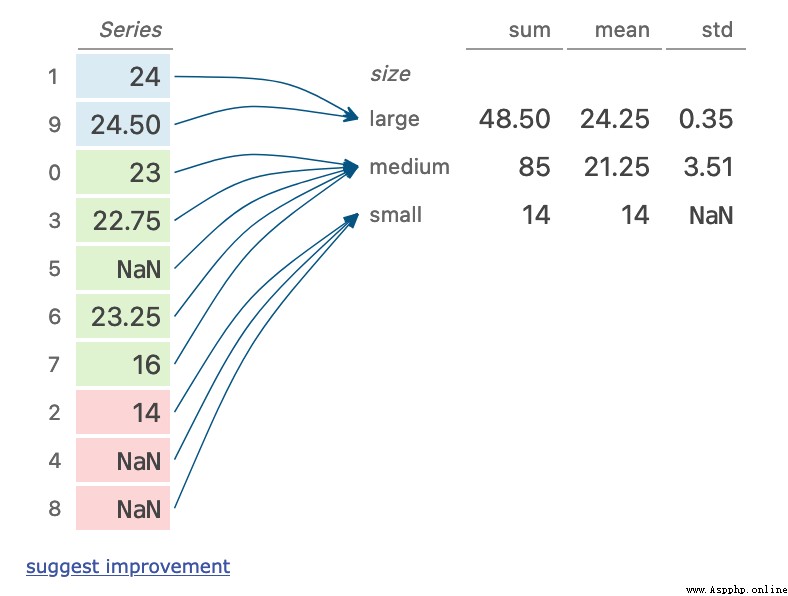
  .agg(['sum', 'mean', 'std'])
)
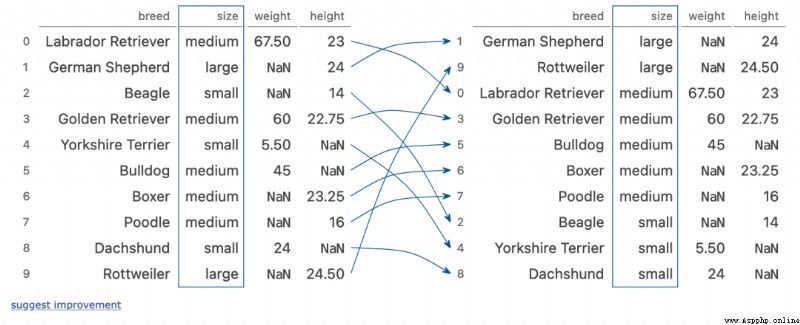
Execution steps
according to size Columns sort the data
according to size Grouping
For within group height Calculate
df.loc[:, df.loc['two'] <= 20]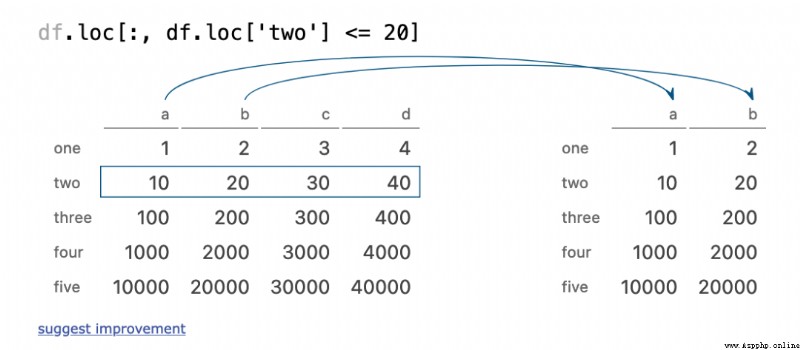
dogs.loc[(dogs['size'] == 'medium') & (dogs['longevity'] > 12), 'breed']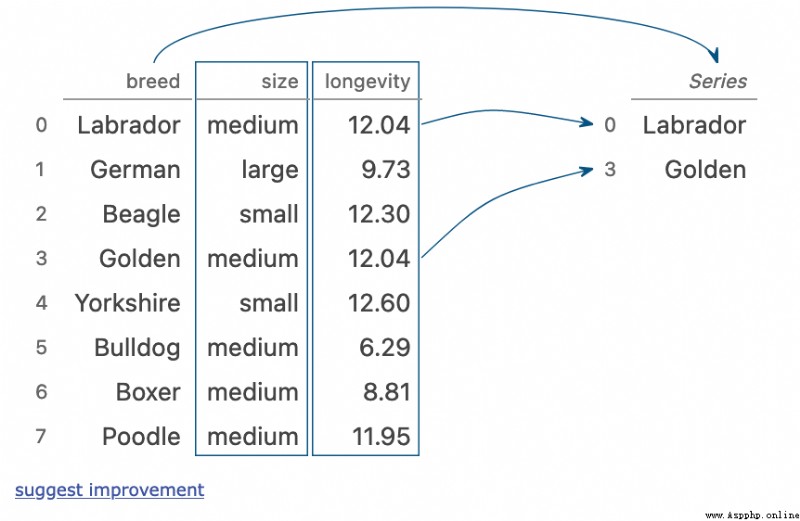
dogs.drop(columns=['type'])
ppl.join(dogs)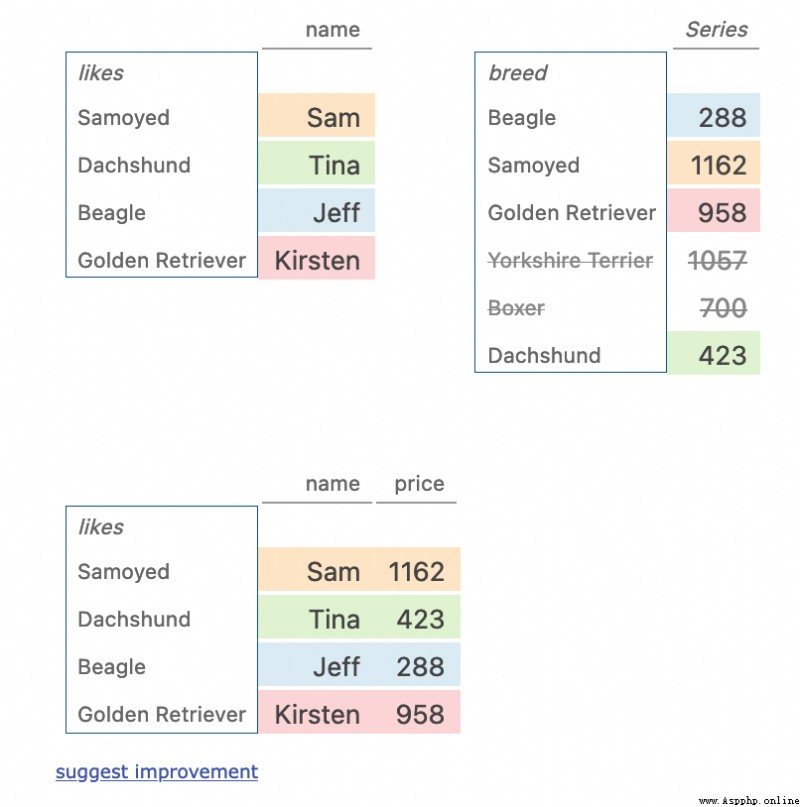
ppl.merge(dogs, left_on='likes', right_on='breed', how='left')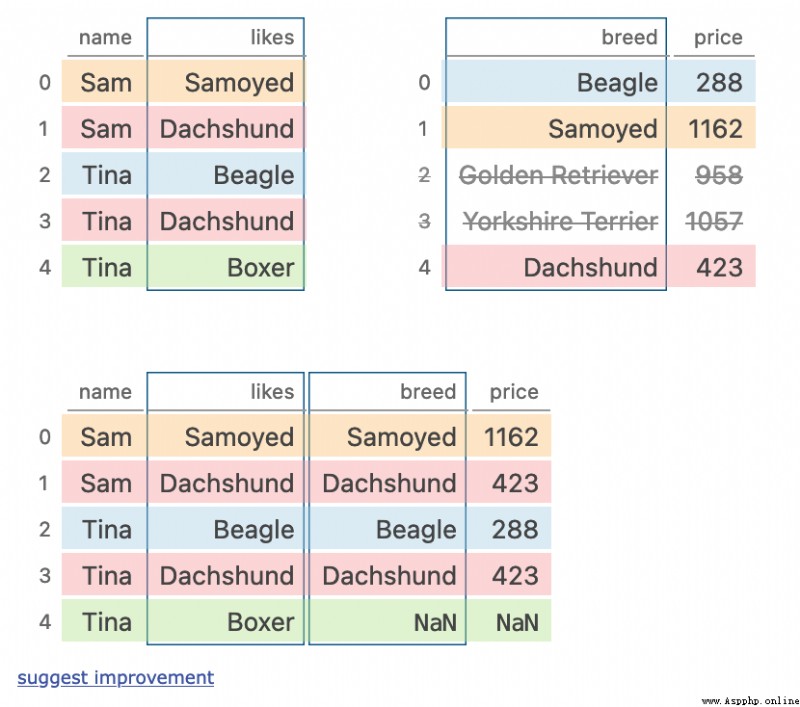
dogs.pivot_table(index='size', columns='kids', values='price')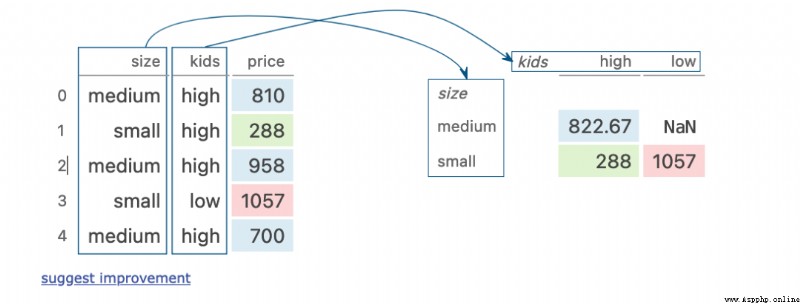
dogs.melt()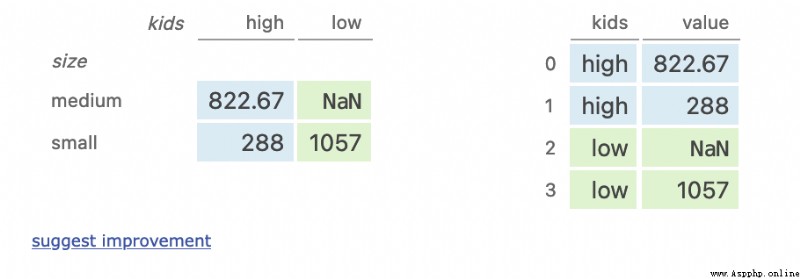
dogs.pivot(index='size', columns='kids')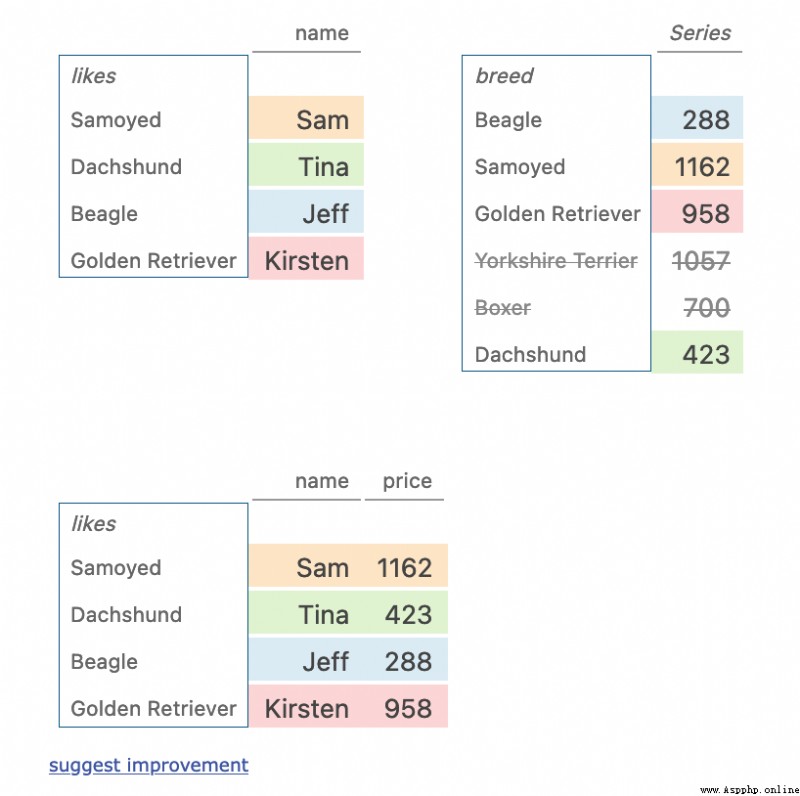
dogs.stack()
dogs.unstack()
dogs.reset_index()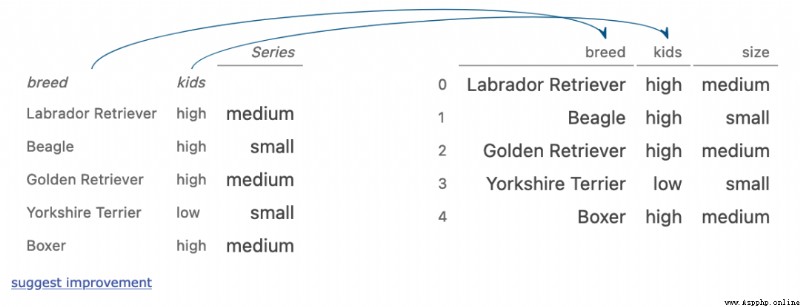
dogs.set_index('breed')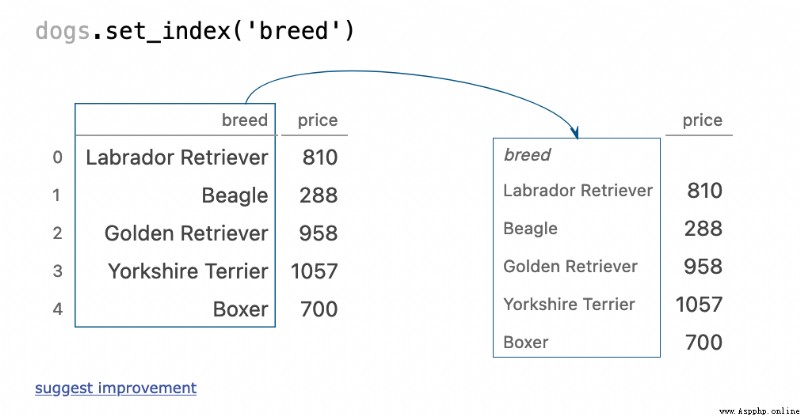

Looking back
Matplotlib Two methods of drawing torus !
13 individual python Necessary knowledge , Recommended collection !
Interesting Python Visualization techniques !
Low code out of half a lifetime , Come back or " cancer "!
 Share
Point collection
A little bit of praise
Click to see