The drawing of scatter diagram , Will use plot In bag scatter() function
【 Syntax and parameters 】:
def scatter(x: Any,
y: Any,
s: Any = None, #s Dimensions of sketch points
c: Any = None, #c Change the color of the point ( You can customize the color of points ) Pay attention to the difference between color mapping and color mapping
marker: Any = None,
cmap: Any = None,
norm: Any = None,
vmin: Any = None,
vmax: Any = None,
alpha: Any = None,
linewidths: Any = None,
*,
edgecolors: Any = None,
plotnonfinite: bool = False,
data: Any = None,
**kwargs: Any) -> Any
【 Add 】: To change the color of the data point , to scatter() Pass parameters c , And set it to the name of the color you want to use ,c=‘red’. You can still use it RGB Color mode custom colors . To specify a custom color , Transitive parameters c , And set it to a tuple ( Pass on RGB value ),c=(0, 0, 0.8).
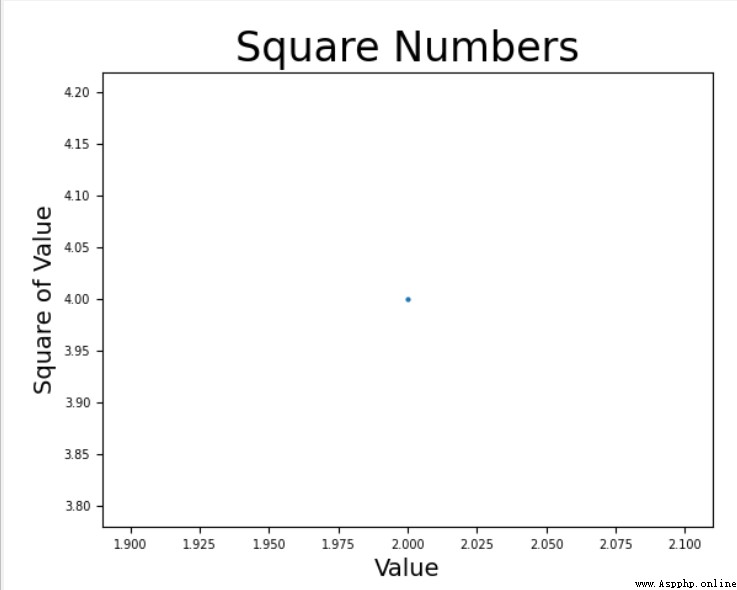
(1) Draw a single scatter
def show_singlepoint():
# Draw a scatter
plt.scatter(2, 4,s=4) #s Dimensions of sketch points
# Set the chart title and label the axis
plt.title("Square Numbers", fontsize=24)
plt.xlabel("Value", fontsize=14)
plt.ylabel("Square of Value", fontsize=14)
# Set the size and position of the tick marks
plt.tick_params(axis='both', which='major', labelsize=7)
# Drawing graphics
plt.show()

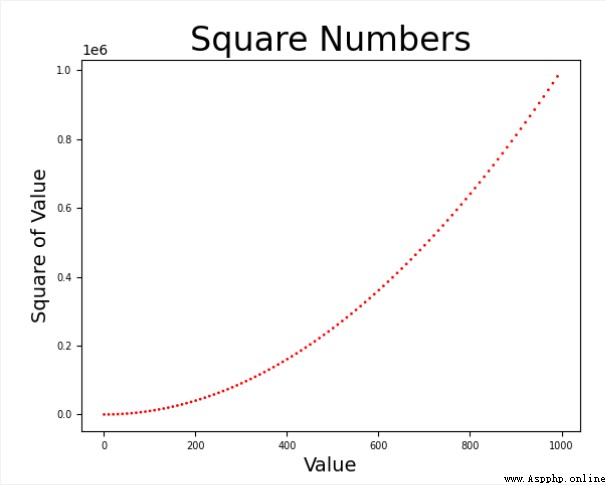
(2) Draw a series of points
To draw a series of points , to scatter() Pass two, each containing x Values and y List of values
The coordinates are automatically mapped one by one
def anypoints():
# Realize automatic calculation of data Use Python Self iteration , Get the coordinates of the points
x_values = list(range(1, 1001,10))# establish x Value of coordinates
y_values = [x ** 2 for x in x_values] # List of analytical Automatically add list element values
#edgecolor='none' Delete profile c='red' Change the color of the point ( You can customize the color of points )
# The default color is black outline , Blue dot
plt.scatter(x_values, y_values,s=4,edgecolor='none',c='red')
# Set the chart title and label the axis
plt.title("Square Numbers", fontsize=24)
plt.xlabel("Value", fontsize=14)
plt.ylabel("Square of Value", fontsize=14)
# Set the scale mark size
plt.tick_params(axis='both', which='major', labelsize=7)
# Set the value range of each axis
# plt.axis([0, 1100, 0, 1100000])
# Chart display
plt.show()
# Chart storage plt.savefig(" Save filename ") Save in and current python File in the same directory folder
plt.savefig('squares_plot.png',bbox_inches = 'tight')
#bbox_inches = 'tight' Specify to crop out the extra blank area of the chart
