Record your learning process .
There are data from many provinces , I want to ask for a comprehensive . These data exist separately csv in . as follows :
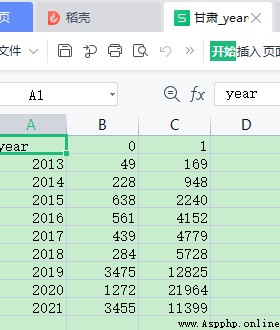
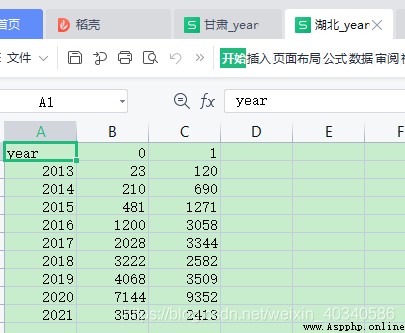
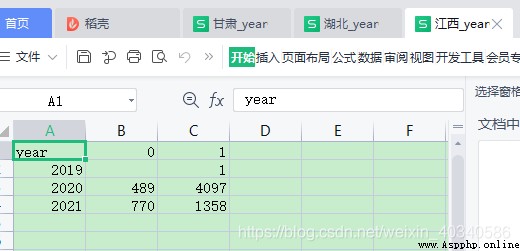
I want to add up all the provinces , Calculate the sum of the whole country . In this case, you need to add the corresponding values in the data table .
The code is as follows :
First read in a data table , such as
df1 It's from Hubei .
stay df1 Create an empty table based on .
df_empty = pd.DataFrame(np.zeros(df1.shape), columns=df1.columns, index=df1.index)
such df_empty yes
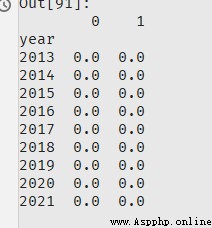
And then write a for loop , Add in one by one .
for i in range(len(result_list)):
print("\n************\n")
print(result_list[i])
print(prov_list[i])
dfi = pd.read_csv(os.path.join(result_data_dir, result_list[i]), index_col='year')
print(dfi)
dfi = dfi.fillna(0)
print(i)
df_empty = df_empty.add(dfi, fill_value = 0)
print(df_empty)
There is a lot of print in the middle , In fact, the key is the two sentences .
dfi = pd.read_csv(os.path.join(result_data_dir, result_list[i]), index_col='year')
This sentence ensures that the data index read in is the same , The columns are the same .
Add up ,
df_empty = df_empty.add(dfi, fill_value = 0)
This sentence can make the data tables add , It is equivalent to the dot addition of the matrix .
The final results are as follows
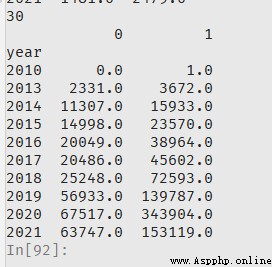
among fill_value=0, Don't omit , Because if you don't add , that add When , Will turn some missing cells into missing cells , In the end, there will be many deficiencies .
It seems that there is no line in the past , such as 2010, Will be automatically added . There are more in the total data table 2010 This business .