This gesture note , It's messy , Record the learning process .
The first 7 Chapter . Data cleaning
"""
Series Of map Method can accept a function or a dictionary object with a mapping relationship ,
Use map It is a convenient way to realize element level transformation and other data cleaning work .
map Is a common function , You can use it , Reassign variables , Like this .
"""
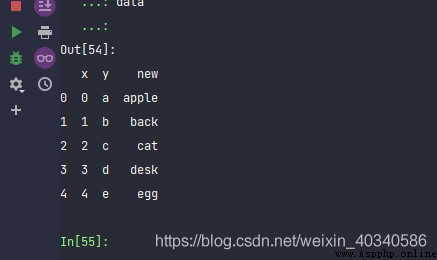
data = pd.DataFrame({'x':range(5), 'y':list('abcde')})
data
char2word = {
'a':'apple',
'b':'back',
'c':'cat',
'd':'desk',
'e':'egg'
}
data['new'] = data['y'].map(char2word)
data
You can get .

'''
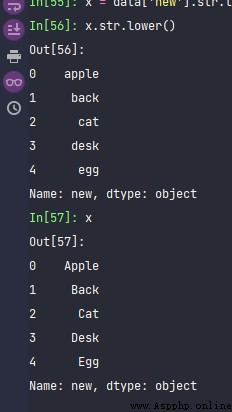
lower and title It can be written in case
'''
x = data['new'].str.title()
x.str.lower()

#########################
############ replace
#########################
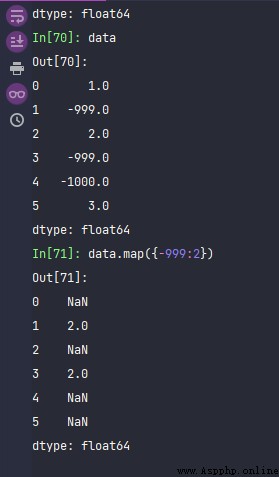
data = pd.Series([1., -999., 2., -999., -1000., 3.])
data
import numpy as np
data.replace(-999, np.nan)
data.replace([-999, -1000], np.nan)
data.replace([-999, -1000], [np.nan, 0])
data.replace({-999: np.nan, -1000: 0})
'''
replace Accept Single value , list , Dictionaries , So it's not ?
'''
'''
data
data.replace([{-999, 2:0}, 3:333])
data.replace([[-999,3], 2], [np.nan, 0])
### That's not good
data.map({-999:2})
dat
If you use replace, Then those without corresponding values will be replaced with missing values .
data.map({'-999':np.nan})
The result will be all missing values , Because the others have no corresponding , All become missing .
rename Method .
########################
########### rename Axis index
########################
data = pd.DataFrame(np.arange(12).reshape((3, 4)),
index=['Ohio', 'Colorado', 'New York'],
columns=['one', 'two', 'three', 'four'])
data
transfom = lambda x: x[:4].upper()
'''
This function can take the first word 4 Letters , Then convert to uppercase .
'''
data.index.map(transfom)
'''
transorm It's a function .
'''
data.index = data.index.map(transfom)
data
data.rename(index=str.title, columns=str.upper)
#### You can write directly like this , Quite convenient .
# such as
frame = pd.DataFrame(np.arange(12).reshape(3, 4),
index = ['apple', 'basketboall', 'celebrate'],
columns = ['xmanufact', 'killing', 'zicker', 'tankre'])
frame
'''
Here's another one range The pit of
'''
np.arange(12).reshape(3, 4)
np.asarray(range(12)).reshape(3, 4) # That's how it works .
range(12).reshape(3, 4) # Here we use range You're going to report a mistake , because ,range Will not produce array, np.arange, Will produce a structured sarray
# continue
transfom
frame.index.map(transfom)
frame.index = frame.index.map(transfom)
frame
frame
"""
here frame It has been modified ,
If you want to create a converted version of the dataset ( Instead of modifying the original data ), The more practical method is rename:
The book says ,
"""
frame.rename(index = str.title, columns = str.upper)
############ Special note ,rename You can update some axis labels in combination with dictionary objects :
frame
frame.rename(index = {'APPL':'huawei'}, columns = {'killing':'bill'})
data.rename(
index={'OHIO': "INDIANA"},
columns={'three': 'peekaboo'}
)
data
data.rename(index={'OHIO': "INDIANA"}, columns={'three': 'peekaboo'}, inplace=True)
data
'''
there rename The method is very interesting , You can accept one directly mapper, Like this, ,frame.rename(index = str.title, columns = str.upper)
It's about making , Index of rows , Treat as string , Are capitalized . Column indexes are treated as strings , Are capitalized .
'''
Then there is the discretization method , Is the use of cut
cut function ,
###########################################
################## 7.2 Discretization and bin partition
###########################################
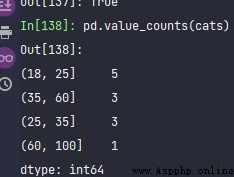
ages = [20, 22, 25, 27, 21, 23, 37, 31, 61, 45, 41, 32]
ages
bins = [18, 25, 35, 60, 100]
cats = pd.cut(ages, bins)
'''44
pandas What is returned is a special Categorical object . junction
Its bottom layer contains a name for different categories Array of types , And one. codes The label of the age data in the attribute
'''
# cats
cats.codes
cats.categories
# cats
# cats.keys()
# cats
# type(cats)
# pd.cut()
# cats.categories
# cats
# cats.Length
# cats.tolist()
# cats.ordered
pd.value_counts(cats)

This is simpler , You can add another labels Options . Or you can skip it .
############### Filter outliers
'''
7.2 Detect and filter outliers
'''
data = pd.DataFrame(np.random.randn(1000, 4))
data.describe()
col = data[2]
col
col[np.abs(col) > 3]
data
data.head()
data.columnnames =['a', 'b', 'c', 'd']
###################
# columnnames The name of the column will not be changed , What will that change ?
data
data.columns = ['a', 'b', 'c', 'd']
data[data['a'] > 3].idxmax()
data['a'] > 3
data[data['a'] > 3]
c = data['c']
c.idxmax()
c
data['c'].nlargest()
c.argmax(2)
np.argpartition(c, )
x = np.array([4, 3, 2, 1])
np.argpartition(x, 3)[0]
np.argpartition(x, 3)
np.argpartition(x,3)
np.argpartition(x,2)
np.argpartition(x,5)
np.argwhere(x, 3)
data[(np.abs(data)> 3).any(1)]
data[data>3].any(1)
(data>3).any(1)
######################### It seems that it must be written in the above way ,
data[(data>3.5).any(1)]