One , Consolidate foundation
# datetime Data types in modules
# date: Store calendar dates in Gregorian form ( Specific date )
# time: Store time in minutes, seconds, milliseconds
# datetime: Store date and time
# timedelta: Two datetime The difference between values ( Japan , second , millisecond )
# 1, Get the current date and time
from datetime import datetime
now = datetime.now()
print now # 2020-06-23 21:43:10.839847
print now.year # 2020
print now.month # 6
print now.day # 23
# 2, to datetime Object plus or minus one or more timedelta, This creates a new object ,
from datetime import timedelta
start = datetime(2011, 1, 7)
end = start + timedelta(12) # stay start On the basis, it has been increased in the future 12 God , namely 2011-01-19 00:00:00
# 3, String and datetime Mutual conversion of
stamp = datetime(2011, 1, 3)
str_timestamp = str(stamp)
print str_timestamp # 2011-01-03 00:00:00
# 4, String formatting
value = '2020-01-03'
print datetime.strptime(value, '%Y-%m-%d') # 2020-01-03 00:00:00
# 5, As follows parse You can parse almost all the date representations that humans can understand
from dateutil.parser import parse
print parse('2020-06-23') # 2020-06-23 00:00:00
print type(parse('2020-06-23')) # <type 'datetime.datetime'>
print parse('7/6/2011') # 2011-07-06 00:00:00
print parse('Jan 31,1997 10:45 PM') # 2020-01-31 22:45:00
print parse('6/12/2011', dayfirst=True) # 2011-12-06 00:00:00 , In the international format , The day usually comes before the month
# 6,pandas Usually used to process grouped dates , Whether these dates are DataFrame Axis index or column ,to_datetime You can parse many different date representations
datestrs=['7/6/2021','8/6/2021']
print pd.to_datetime(datestrs) # DatetimeIndex(['2021-07-06', '2021-08-06'], dtype='datetime64[ns]', freq=None)
Two , Use time series
# 1, Generate a time series
data = pd.date_range(start='20200601', end='20200622')
# Running results :
'''
DatetimeIndex(['2020-06-01', '2020-06-02', '2020-06-03', '2020-06-04',
'2020-06-05', '2020-06-06', '2020-06-07', '2020-06-08',
'2020-06-09', '2020-06-10', '2020-06-11', '2020-06-12',
'2020-06-13', '2020-06-14', '2020-06-15', '2020-06-16',
'2020-06-17', '2020-06-18', '2020-06-19', '2020-06-20',
'2020-06-21', '2020-06-22'],
dtype='datetime64[ns]', freq='D')
'''
print data
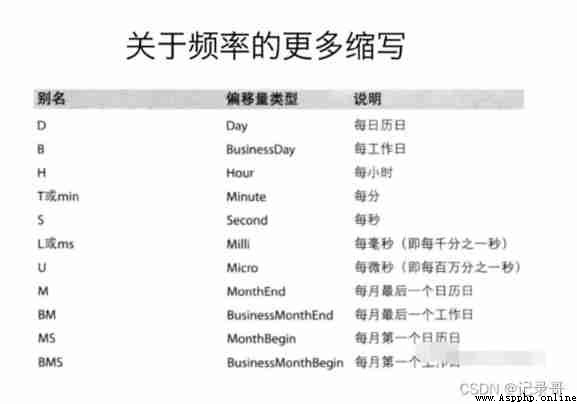
# 2, The last working day of every month ('BM')
data2 = pd.date_range(start='20200401', end='20200531', freq='BM')
print data2 # DatetimeIndex(['2020-04-30', '2020-05-29'], dtype='datetime64[ns]', freq='BM')
# 3, At a certain frequency
data3 = pd.date_range(start='20200401', periods=10, freq='WOM-3FRI')
'''
DatetimeIndex(['2020-04-17', '2020-05-15', '2020-06-19', '2020-07-17',
'2020-08-21', '2020-09-18', '2020-10-16', '2020-11-20',
'2020-12-18', '2021-01-15'],
dtype='datetime64[ns]', freq='WOM-3FRI')
'''
print data3
# 4, stay DataFrame Use time series in
index = pd.date_range('20200601', periods=10)
df = pd.DataFrame(np.random.rand(10), index=index)
# The operation results are as follows :
'''
0
2020-06-01 0.663568
2020-06-02 0.820586
2020-06-03 0.727429
2020-06-04 0.806351
2020-06-05 0.866392
2020-06-06 0.531439
2020-06-07 0.823463
2020-06-08 0.670433
2020-06-09 0.618233
2020-06-10 0.572313
'''
print df
3、 ... and , Resampling
The process of converting a time series from one frequency to another for processing .
Downsampling : Convert high-frequency data into low-frequency data ;
L sampling : Convert low-frequency data into high-frequency data ;
# 1,numpy.random.uniform(low,high,size): From a uniform distribution [low,high) Medium random sampling
t=pd.DataFrame(data=np.random.uniform(10,50,(100,1)),index=pd.date_range('20200101',periods=100))
'''
The operation results are as follows :
0
2020-01-01 16.109240
2020-01-02 37.109396
2020-01-03 41.100273
2020-01-04 36.250896
2020-01-05 21.385565
2020-01-06 20.408651
2020-01-07 10.601832
2020-01-08 48.990757
2020-01-09 44.897395
2020-01-10 27.872911
2020-01-11 43.644149
2020-01-12 13.645889
2020-01-13 31.969064
2020-01-14 16.091363
2020-01-15 18.483800
2020-01-16 11.795118
2020-01-17 43.911655
2020-01-18 40.053488
2020-01-19 32.196706
2020-01-20 45.209541
2020-01-21 26.806089
2020-01-22 49.444711
2020-01-23 24.447382
2020-01-24 27.618497
2020-01-25 19.940859
2020-01-26 21.563518
2020-01-27 14.521243
2020-01-28 48.821115
2020-01-29 31.634394
2020-01-30 26.270981
... ...
2020-03-11 37.083283
2020-03-12 37.582650
2020-03-13 30.518648
2020-03-14 37.961496
2020-03-15 10.778531
2020-03-16 29.848324
2020-03-17 38.424908
2020-03-18 35.883167
2020-03-19 40.830069
2020-03-20 30.132450
2020-03-21 37.326055
2020-03-22 31.600755
2020-03-23 27.059394
2020-03-24 19.986316
2020-03-25 41.713622
2020-03-26 34.950293
2020-03-27 47.312944
2020-03-28 42.995630
2020-03-29 33.860867
2020-03-30 30.379033
2020-03-31 43.747291
2020-04-01 38.165414
2020-04-02 11.608507
2020-04-03 16.251798
2020-04-04 45.453179
2020-04-05 26.159734
2020-04-06 25.182784
2020-04-07 32.538120
2020-04-08 28.565222
2020-04-09 48.178500
[100 rows x 1 columns]
'''
print t
# 2, Down sampling , One sample per month , Then average them
mean=t.resample('M').mean()
'''
The operation results are as follows :
0
2020-01-31 31.483178
2020-02-29 29.002540
2020-03-31 30.286941
2020-04-30 32.264590
'''
print mean
# 3, Down sampling , One sample every ten days , Then find the number
count=t.resample('10D').count()
'''
The operation results are as follows :
0
2020-01-01 10
2020-01-11 10
2020-01-21 10
2020-01-31 10
2020-02-10 10
2020-02-20 10
2020-03-01 10
2020-03-11 10
2020-03-21 10
2020-03-31 10
'''
print count