The content of the article comes from learning : MIT open class : Single Variable Calculus - Derivative and rate of change - Netease public class
I studied calculus in college , I feel like I'm going to forget all .... alas , Rebuild it
preparation :
(1) install python( As a learning tool , You can find the derivative , You can draw a picture ).
download A install naconda | Individual Edition And install
After installation , Use Anaconda Command line , In the command line window, run
pip install sympy
pip install pandas
pip install matplotlib
Section 1 The derivative can be defined as the slope of the tangent ( Pay attention to the class , And use python Solving math problems )
Explain the formula : fx = 1 / x
stay Anaconda navigater Open in Jyputer
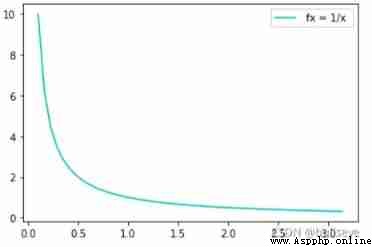
One 、 First draw the function fx
# assigned 50 values from 0.1 to 3.1415... to x
x = np.linspace(0.1,np.pi,50)
y = 1 / x
plt.plot(x,y, 'c', label=' fx = 1/x ')
plt.legend(loc='upper right')
plt.show() 
Two 、 Derivation :
from sympy import *
x = Symbol('x')
f = 1/x
derivative_f = f.diff(x)
derivative_f
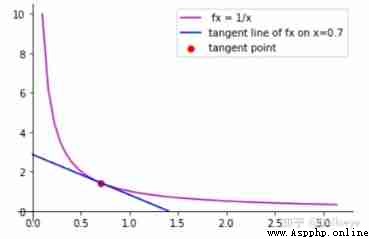
By seeking x0 stay 0.7 The tangent at x Axis and y The intercept on the axis gets the tangent
3、 ... and 、 Find the intercept
Because of the derivative dy/dx = -1/(x*x) => y-y0 / x-x0 = -1/(x0*x0)
When y=0 The tangent can be found at x The intercept of the axis
x, y, x0, y0 = symbols('x y x0 y0')
expr = (y-y0)/(x-x0) + 1/(x0*x0)
expr.subs(y,0).subs(y0, 1/x0)
eq1 = Eq(-1 / (x0*(x-x0)) + 1/(x0*x0))
sol = solve(eq1)
sol
y = 0 x=2*x0 = 1.4 =>x The intercept of the axis [1.4, 0]
Find the tangent at y The intercept of the axis : because y = 1 / x , x and y Have symmetry , therefore When x = 0 y=2*y0 = 2/ x0
expr = 2/x0
expr.subs(x0,0.7)
The tangent is at y The intercept of the axis [0, 2.85714285714286]
Four 、 Draw the tangent line
# Draw axis
fig = plt.figure()
ax = fig.add_subplot(1, 1, 1)
ax.spines['left'].set_position('zero')
ax.spines['bottom'].set_position('zero')
ax.spines['right'].set_color('none')
ax.spines['top'].set_color('none')
ax.xaxis.set_ticks_position('bottom')
ax.yaxis.set_ticks_position('left')
# draw fx
x = np.linspace(0.1,np.pi,50)
y = 1 / x
plt.plot(x,y, 'm', label=' fx = 1/x ')
plt.legend(loc='upper right')
# draw x = 0.7 The tangent of
p1 = [0, 2.85714285714286] # spot p1 The coordinate values of
p2 = [1.4, 0] # spot p2 The coordinate values of
plt.plot([p1[0], p2[0]], [p1[1], p2[1]], color='b', label='tangent line of fx on x=0.7')
plt.legend(loc='upper right')
# Draw tangent point
plt.scatter(0.7, 1/0.7, c='r', label='tangent point')
plt.legend(loc='upper right')
plt.show()