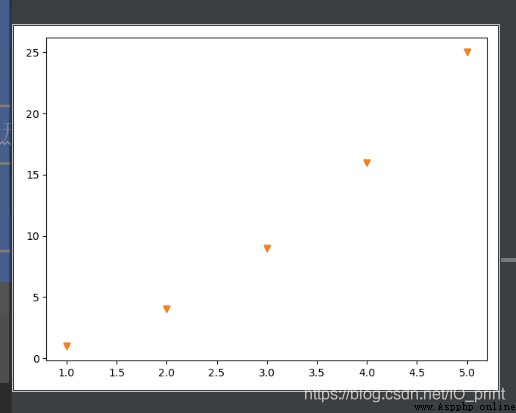
繪制散點圖
import matplotlib.pyplot as plt
x_values = [1, 2, 3, 4, 5]
y_values = [1, 4, 9, 16, 25]
# 繪制散點圖
# plt.scatter(x_values, y_values, s=100)
plt.scatter(x_values, y_values, marker='v') #marker為顯示圖形點的形狀 D 菱形 o 運行 v 三角形
plt.show()

繪制折線圖
import matplotlib.pyplot as plt
x_values = [1, 2, 3, 4, 5]
y_values = [1, 4, 9, 16, 25]
#折線圖
# 格式:plt.plot(x,y)
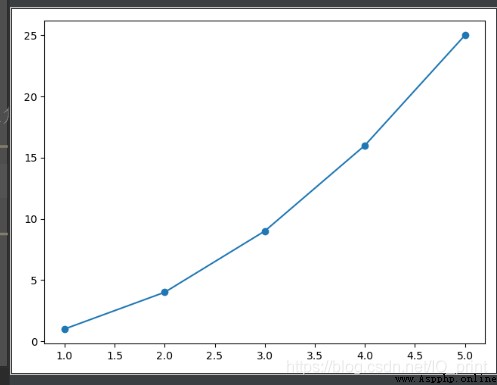
plt.plot(x_values, y_values, marker='o')
plt.show()

實現動態繪圖
import matplotlib.pyplot as plt
import random
plt.ion() # 開啟interactive mode 成功的關鍵函數
plt.figure(1)
t = [0]
y = [0]
for i in range(2000):
plt.clf() # 清空畫布上的所有內容
t.append(random.randint(1, 10))
y.append(random.randint(1, 10))
plt.plot(t, y, '-r')
plt.pause(0.01)