Catalog
One .Figure Containers and subgraph objects
Figure Containers
Subgraph objects
Subplot
Axes
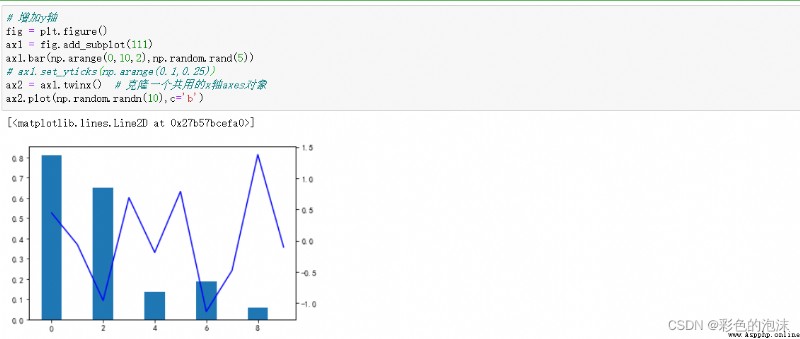
Draw Double y Axis
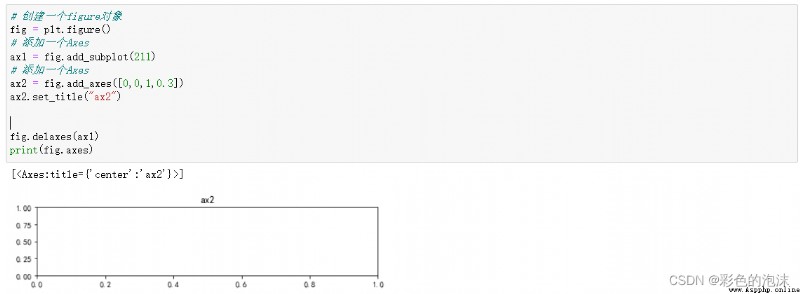
Delete a child graph object
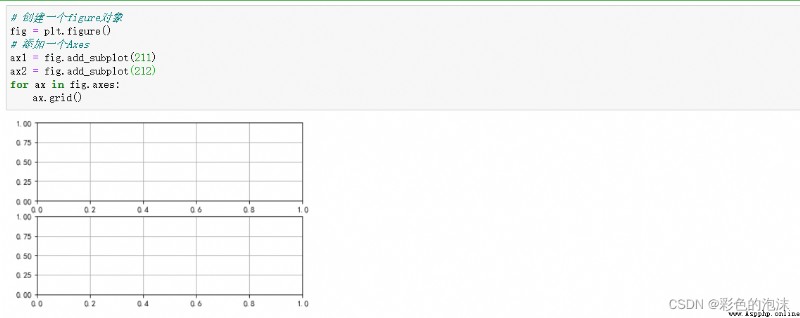
Get a child graph object to operate
Two .Axis Container and multi graph layout
Axis Containers
Axis Introduce
Set up x Axis and y Axis label The location of
Set the scale format on the scale
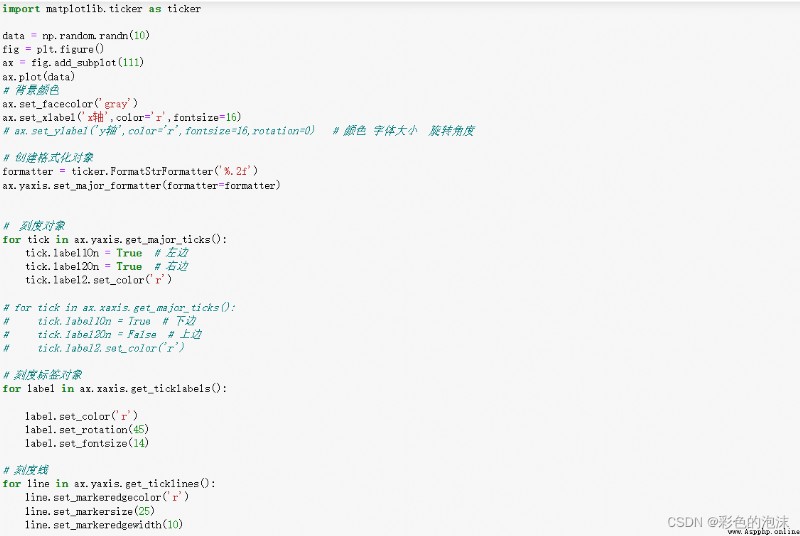
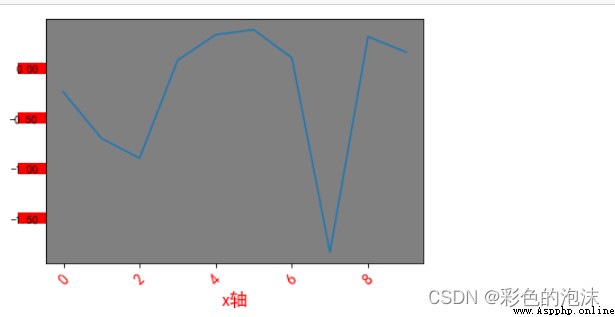
Set scale object , Scale label object , Calibration line
Multi map layout
Adjust the spacing of subgraphs
Custom layout
Matplotlib The drawing is located in the picture (Figure) In the object , We can go through plt.figure() Create a new picture :
from matplotlib import pyplot as plt
fig = plt.figure()
You can use the parameter figsize To set the size scale of the canvas :
example :

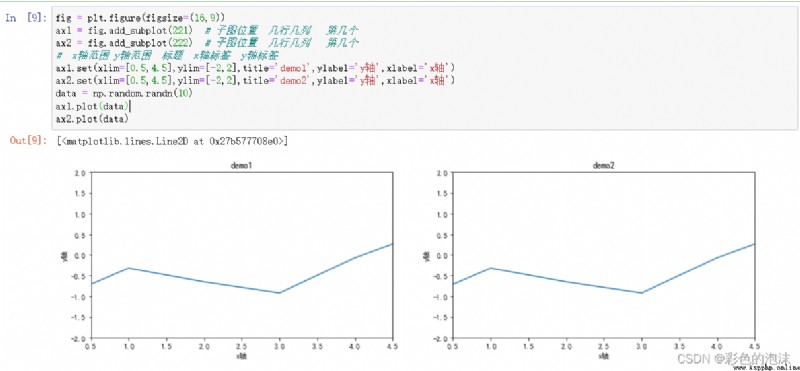
(1)plt.subplot(# Subgraph location A few lines and columns Number one ) Create one or more child graph objects ;
(2)fig.add_subplot(# Subgraph location A few lines and columns Number one ) The effect is consistent with the above method , The difference is that figure;
example :
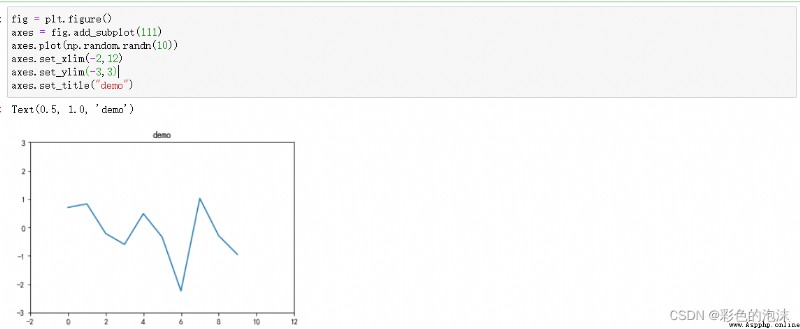
When setting the parameters of the subgraph , Besides using set Methods are set together , It can also be set separately :
as follows :
(1)fig.add_axes(# Origin coordinates Length scale of original drawing ) Use this method to create subgraphs , With the above subplot There is a big difference , As shown below :
example :
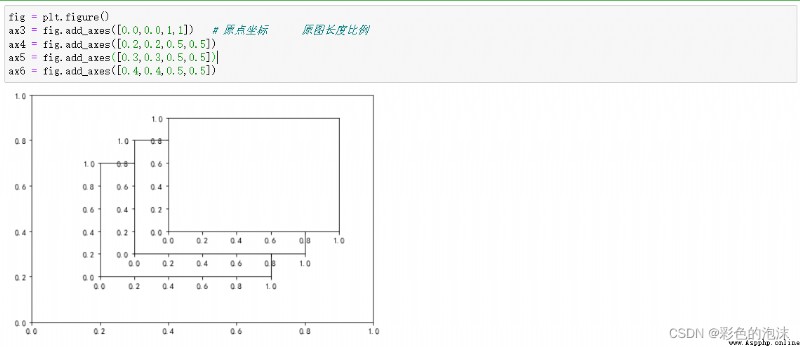
In the absence of special requirements , We generally do not use this method to create subgraphs .
(1)twinx() Clone a shared x Axis objects ;
example :
(1)fig.delaxes()
example :
Use for Loop to fig Of axes Traverse ;
example :
Axis It stands for x Axis or y Object of axis . contain Tick( scale ) object ,TickLabel Scale text object , as well as AxisLabel Axis text object .axis Object has some methods to manipulate scales, text, etc .
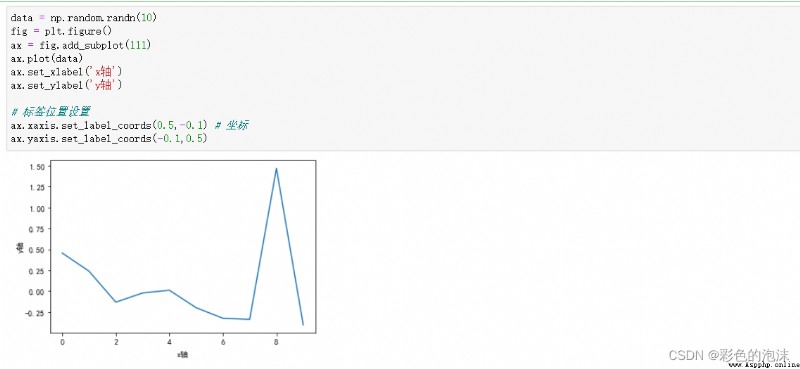
(1)ax1.xaxis.set_label_coords(x,y)
(2)ax1.yaxis.set_label_coords(x,y)
example :
from matplotlib import ticker
formatter = ticker.FormatStrFormatter(" Custom format ")
ax1.yaxis.set_major_formatter(formatter)
example ( send y The axis scale retains two decimal places ):

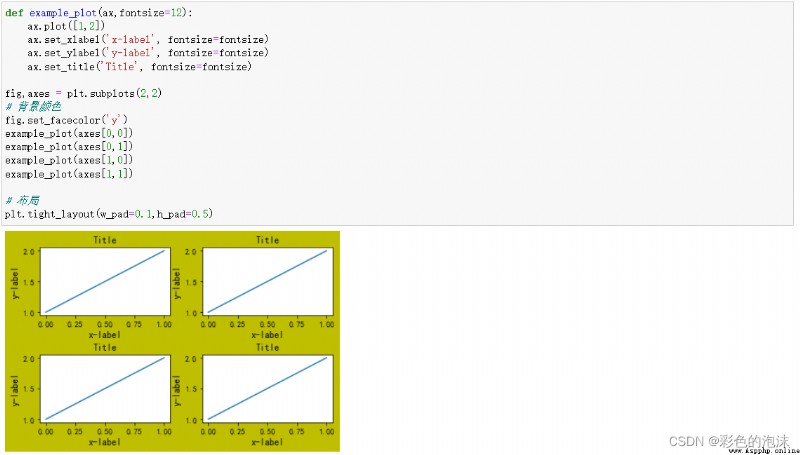
Method :subplots()
import matplotlib.pyplot as plt
fig,axes = plt.subplots(2,2)
axes[0,0].plot([1,2],[1,2])
axes[0,1].plot([1,2],[1,2])
axes[1,0].plot([1,2],[1,2])
axes[1,1].plot([1,2],[1,2])
axes[0,0].set_xlabel("x-label")
axes[0,0].set_ylabel("y-label")
axes[0,0].set_title("title")
axes[0,1].set_xlabel("x-label")
axes[0,1].set_ylabel("y-label")
axes[0,1].set_title("title")
axes[1,0].set_xlabel("x-label")
axes[1,0].set_ylabel("y-label")
axes[1,0].set_title("title")
axes[1,1].set_xlabel("x-label")
axes[1,1].set_ylabel("y-label")
axes[1,1].set_title("title")
plt.show()
example :
(1)fig.subplots_adjust(left=None,bottom=None,right=None,top=None,wspace=None,hspace=None)
(2) Use the above method :fig.tight_layout(h_pad=None,w_pad=None)
For complex layouts, you need to use GridSpec object , adopt fig.add_gridspec(2,2) Create fence mode , In the use of fig.add_plot Add subgraph .
When adjusting the sub graph scale :fig.add_gridspec(2,2,width_ratios=width,height_ratios=height)