使用方法
添加label的
繪制虛線
level
設置顏色和線條寬度
其他設置
使用方法matplotlib.pyplot.contour(*args, data=None, **kwargs)參數介紹:

參數X,YZ(M,N)類數組level
import numpy as npimport matplotlib.pyplot as pltX, Y = np.meshgrid(np.linspace(-3,3,256), np.linspace(-3,3,256))Z = (1 - X/2 + X**5 + Y**3) * np.exp(-X**2 - Y**2)levels = np.linspace(np.min(Z), np.max(Z), 7)fig, ax = plt.subplots()ax.contour(X, Y, Z, levels=levels)plt.show()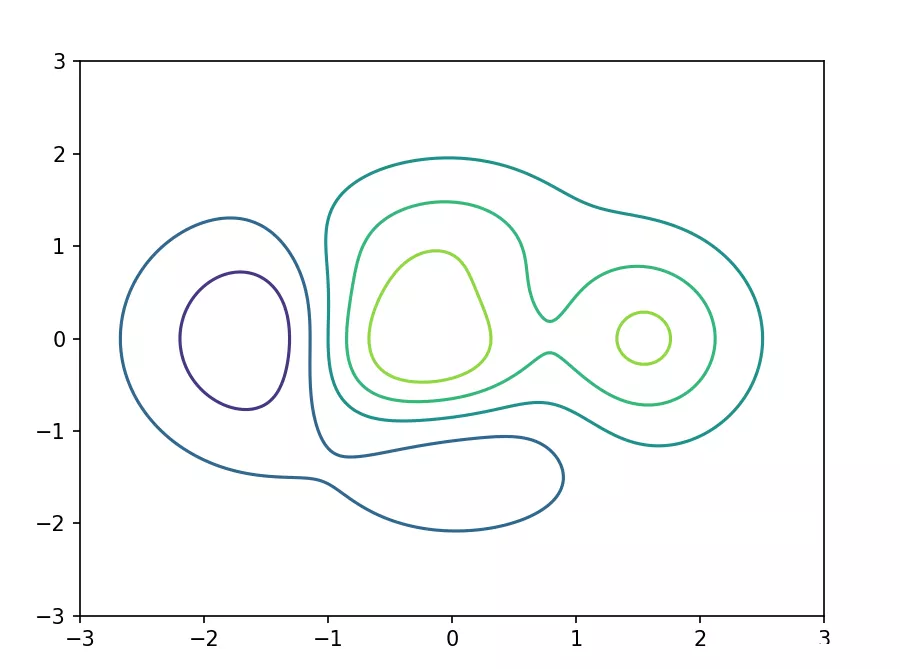
需要住的是inline參數.默認是inline=True
import numpy as npimport matplotlib.cm as cmimport matplotlib.pyplot as pltdelta = 0.025x = np.arange(-3.0, 3.0, delta)y = np.arange(-2.0, 2.0, delta)X, Y = np.meshgrid(x, y)Z1 = np.exp(-X**2 - Y**2)Z2 = np.exp(-(X - 1)**2 - (Y - 1)**2)Z = (Z1 - Z2) * 2fig, ax = plt.subplots()CS = ax.contour(X, Y, Z)ax.clabel(CS, inline=True, fontsize=10)ax.set_title('Simplest default with labels')plt.show()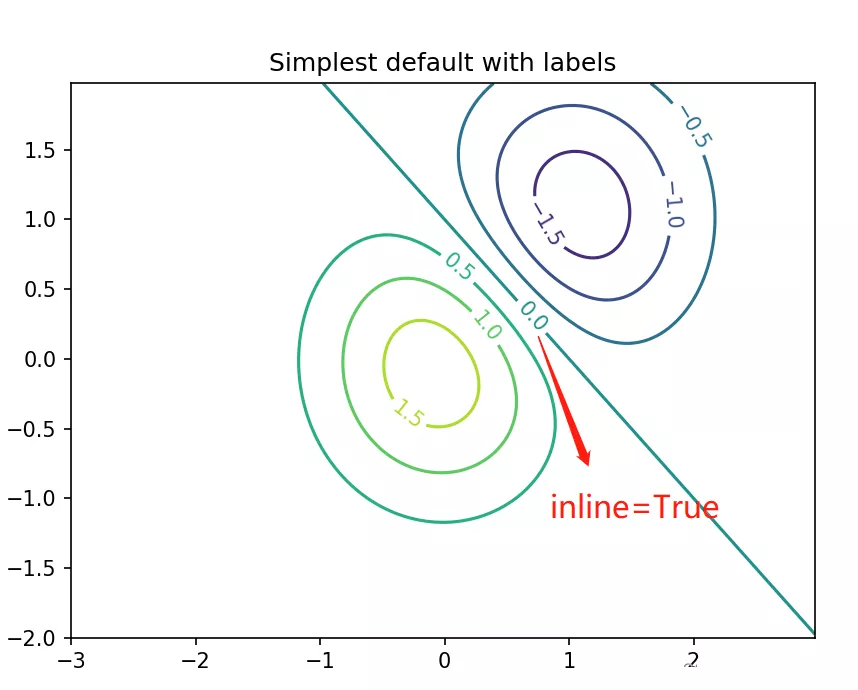
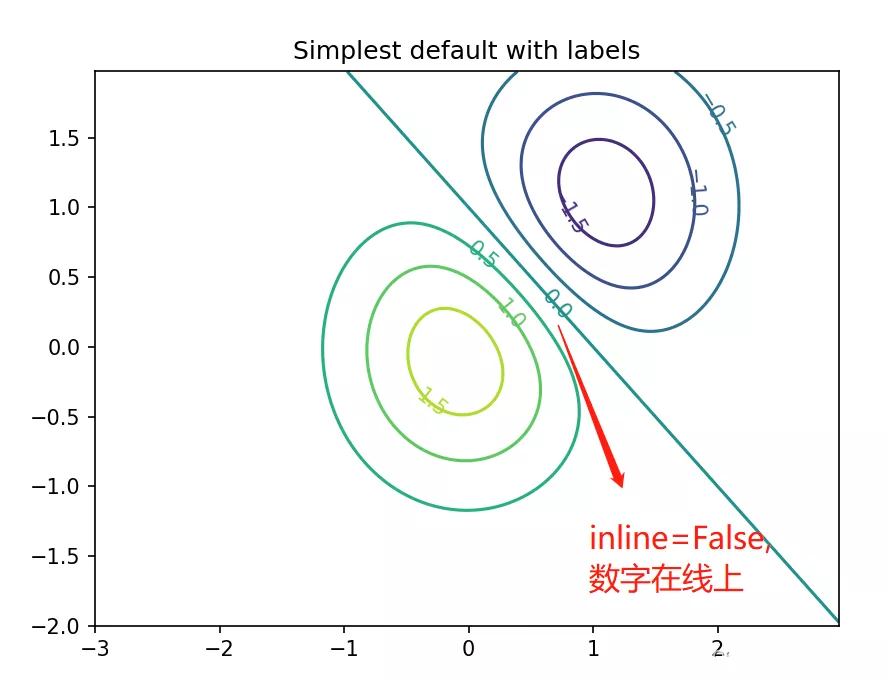
import numpy as npimport matplotlib.cm as cmimport matplotlib.pyplot as pltdelta = 0.025x = np.arange(-3.0, 3.0, delta)y = np.arange(-2.0, 2.0, delta)X, Y = np.meshgrid(x, y)Z1 = np.exp(-X**2 - Y**2)Z2 = np.exp(-(X - 1)**2 - (Y - 1)**2)Z = (Z1 - Z2) * 2fig, ax = plt.subplots()CS = ax.contour(X, Y, Z, 6, colors='k')ax.clabel(CS, fontsize=9, inline=True)ax.set_title('Single color - negative contours dashed')plt.show()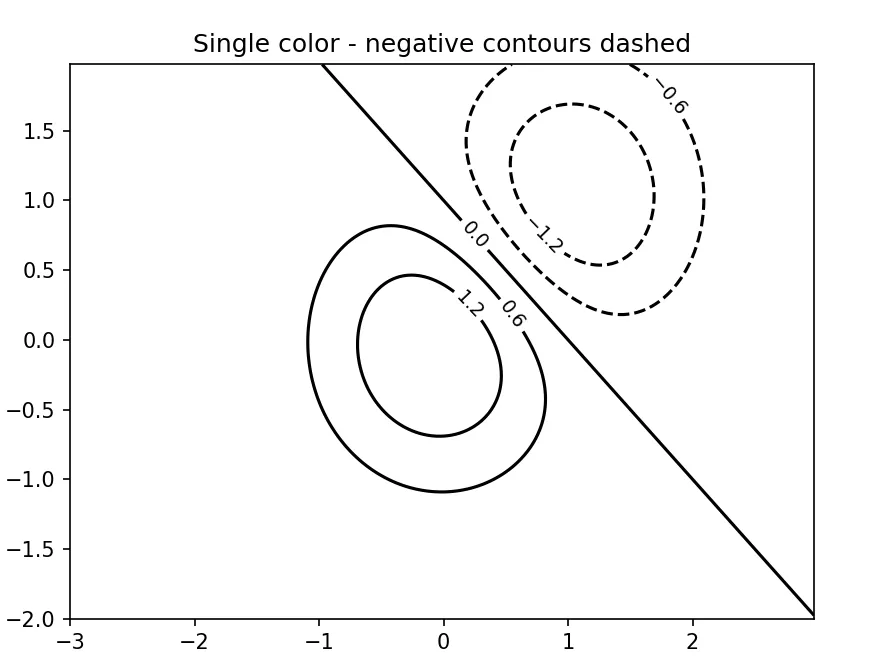
確定等高線數量/位置,選擇不超過n+1個"良好"輪廓級別
import numpy as npimport matplotlib.cm as cmimport matplotlib.pyplot as pltdelta = 0.025x = np.arange(-3.0, 3.0, delta)y = np.arange(-2.0, 2.0, delta)X, Y = np.meshgrid(x, y)Z1 = np.exp(-X**2 - Y**2)Z2 = np.exp(-(X - 1)**2 - (Y - 1)**2)Z = (Z1 - Z2) * 2fig, axs = plt.subplots(nrows=1, ncols=2, figsize=(14,7))axs[0].set_title('levels=6')CS = axs[0].contour(X, Y, Z, 6, colors='k')axs[0].clabel(CS, fontsize=9, inline=True)axs[1].set_title('levels=10')CS1 = axs[1].contour(X, Y, Z, 10, colors='k')axs[1].clabel(CS1, fontsize=9, inline=True)plt.show()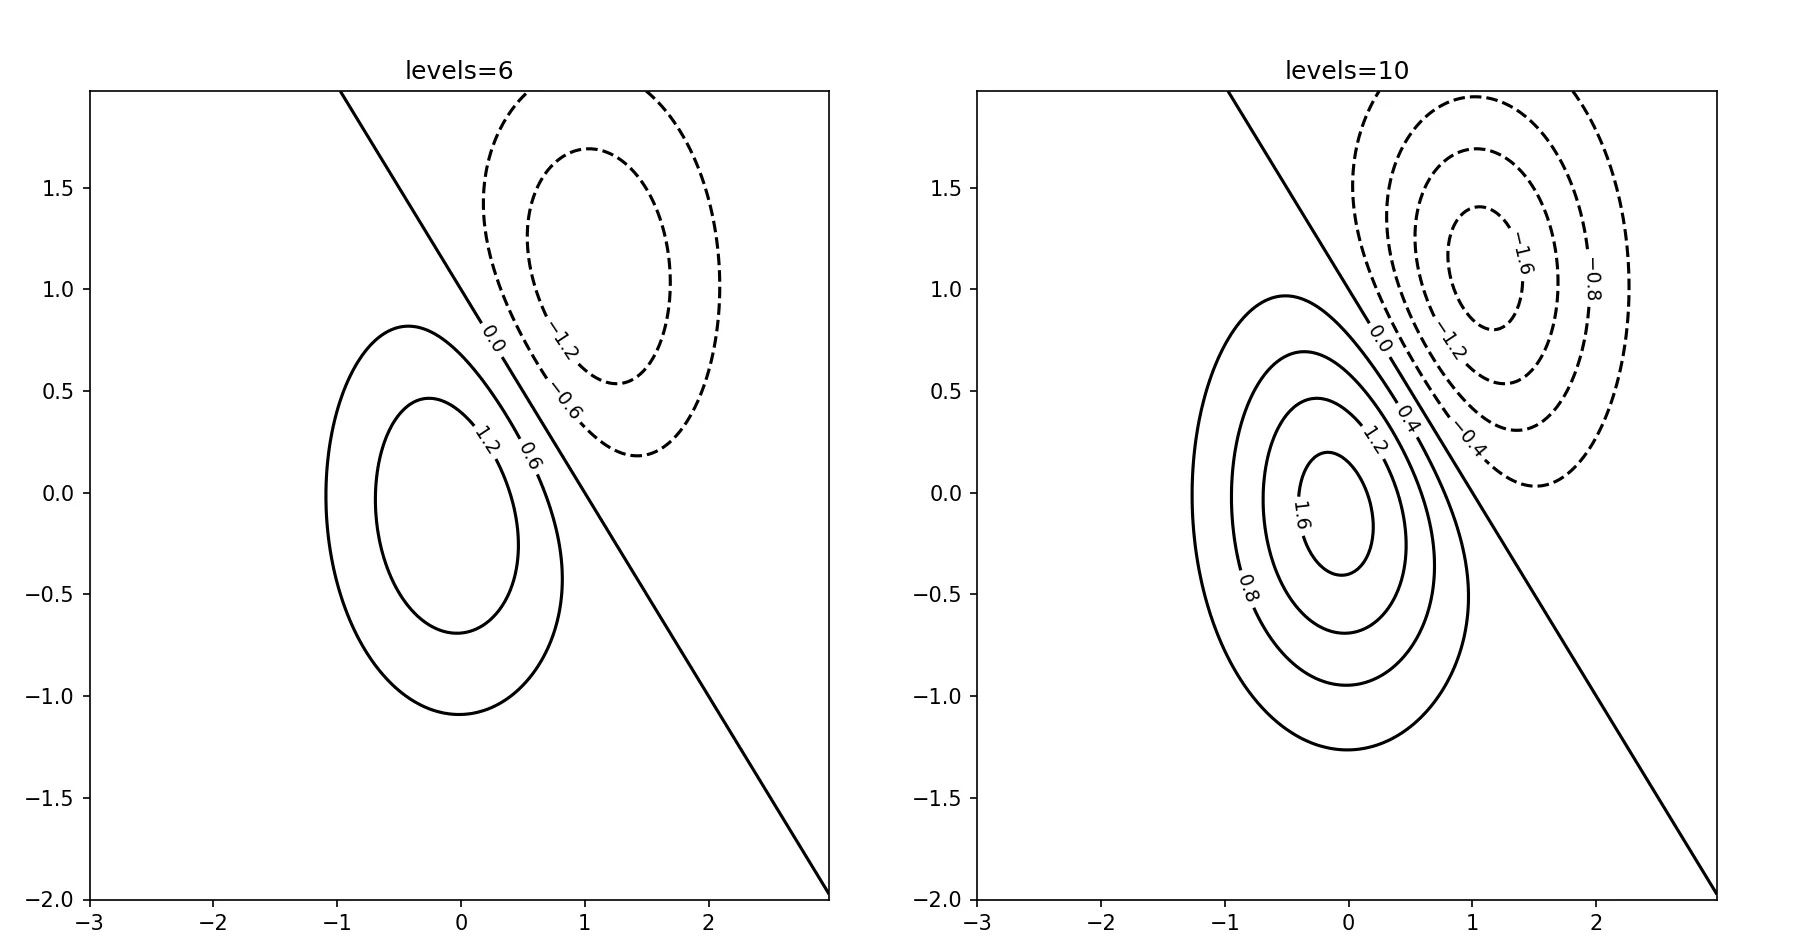
import numpy as npimport matplotlib.cm as cmimport matplotlib.pyplot as pltdelta = 0.025x = np.arange(-3.0, 3.0, delta)y = np.arange(-2.0, 2.0, delta)X, Y = np.meshgrid(x, y)Z1 = np.exp(-X**2 - Y**2)Z2 = np.exp(-(X - 1)**2 - (Y - 1)**2)Z = (Z1 - Z2) * 2fig, ax = plt.subplots()CS = ax.contour(X, Y, Z, 6, linewidths=np.arange(.5, 4, .5), colors=('r', 'cyan', 'blue', (1, 1, 0), '#afeeee', '0.5'), )ax.clabel(CS, fontsize=9, inline=True)ax.set_title('Crazy lines')plt.show()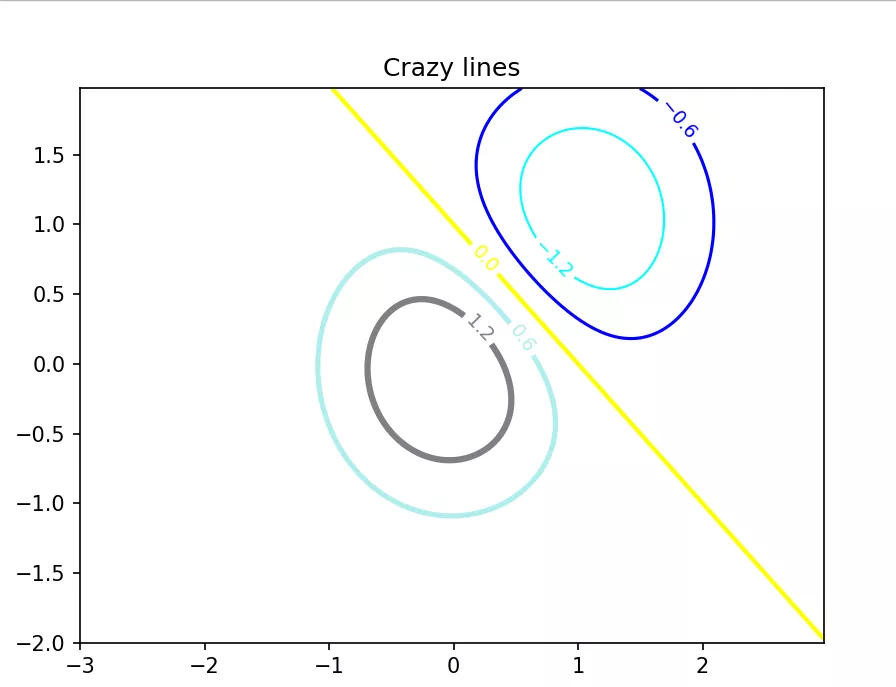
import numpy as npimport matplotlib.cm as cmimport matplotlib.pyplot as pltdelta = 0.025x = np.arange(-3.0, 3.0, delta)y = np.arange(-2.0, 2.0, delta)X, Y = np.meshgrid(x, y)Z1 = np.exp(-X**2 - Y**2)Z2 = np.exp(-(X - 1)**2 - (Y - 1)**2)Z = (Z1 - Z2) * 2fig, ax = plt.subplots()im = ax.imshow(Z, interpolation='bilinear', origin='lower', cmap=cm.gray, extent=(-3, 3, -2, 2))levels = np.arange(-1.2, 1.6, 0.2)CS = ax.contour(Z, levels, origin='lower', cmap='flag', extend='both', linewidths=2, extent=(-3, 3, -2, 2))CS.collections[6].set_linewidth(4)ax.clabel(CS, levels[1::2], # label every second level inline=True, fmt='%1.1f', fontsize=14)CB = fig.colorbar(CS, shrink=0.8)ax.set_title('Lines with colorbar')CBI = fig.colorbar(im, orientation='horizontal', shrink=0.8)l, b, w, h = ax.get_position().boundsll, bb, ww, hh = CB.ax.get_position().boundsCB.ax.set_position([ll, b + 0.1*h, ww, h*0.8])plt.show()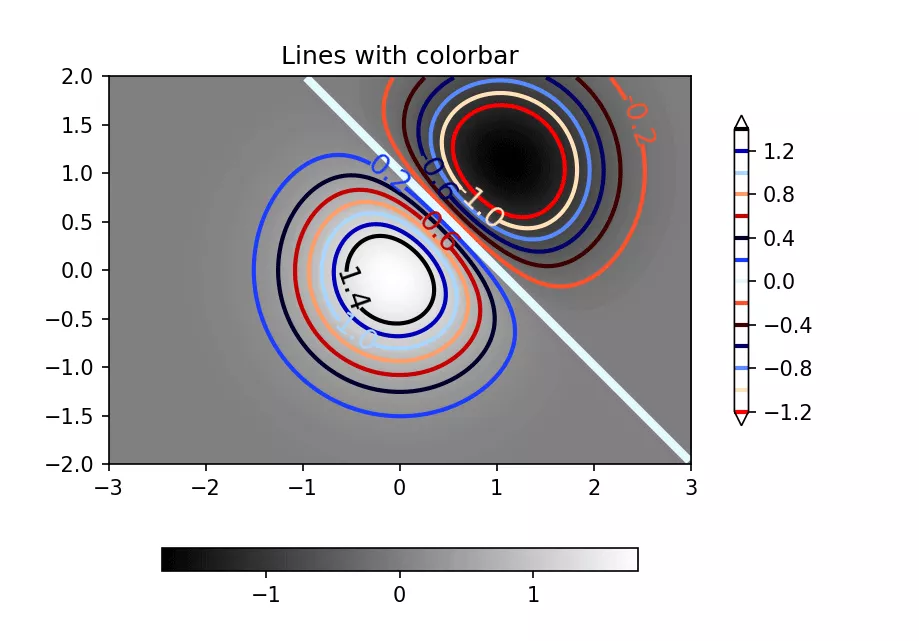
到此這篇關於如何利用python繪制等高線圖的文章就介紹到這了,更多相關python繪制等高線圖內容請搜索軟件開發網以前的文章或繼續浏覽下面的相關文章希望大家以後多多支持軟件開發網!