
Now we need to course grouping , Then select the maximum and minimum values in each group , And keep it
Achieve the following data results :
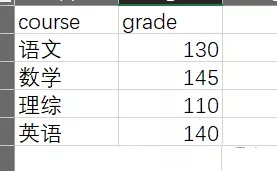
Use it directly groupby function , This effect cannot be achieved directly , Need to be in groupby Add... To the function apply and lambda function
The code is as follows :
import pandas as pddata = pd.read_excel('group_apply.xlsx')data1 = data.groupby('course').apply(lambda t: t[(t['grade']==t['grade'].min()) ^ (t['grade']==t['grade'].max())])
Ahead index, It's two columns , So we need to deal with , This is groypby Generated after function processing , Just delete it
data2 = data1.reset_index(drop=True)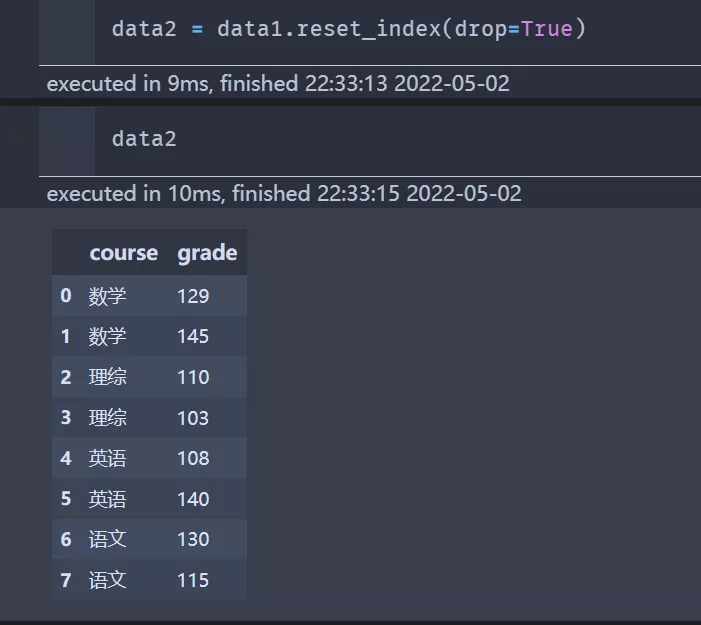
Code integration :
import pandas as pddata = pd.read_excel('group_apply.xlsx')data1 = data.groupby('course').apply(lambda t: t[(t['grade']==t['grade'].min()) ^ (t['grade']==t['grade'].max())])data2 = data1.reset_index(drop=True)Write to excel in :
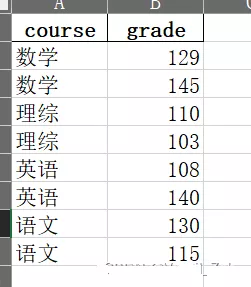
This is about python groupby This is the end of the article on selecting the maximum value after grouping with the function , More about python groupby Please search the previous articles of software development network or continue to browse the relevant articles below. I hope you will support software development network more in the future !