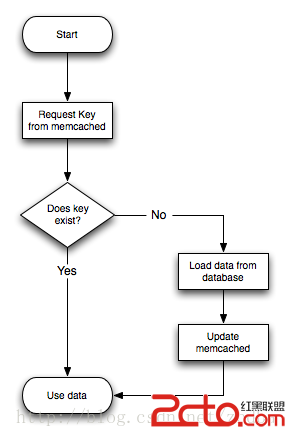
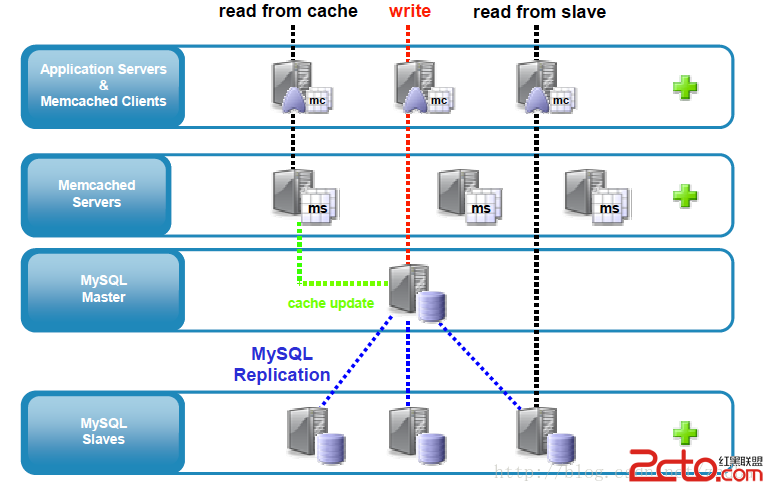
cached data.


Case:
Fotolog, as they themselves point out, is probably the largest site nobody has ever heard of, pulling in more page views than even Flickr. Fotolog has 51 instances of memcached on 21 servers with 175G in use and 254G available. As a large successful photo-blogging site they have very demanding performance and scaling requirements. To meet those requirements they've developed a sophisticated approach to using memcached that others can learn from and emulate.
Memcached的下載:
http://www.memcached.org/files/memcached-1.4.21.tar.gz
在RedHat中,系統自帶Memcached,可以使用yum進行安裝:
yum install memcached
也可以下載包進行安裝,這裡就詳細說明了。
基本使用:
[root@ogg1 bin]# memcached -h
memcached 1.4.4
-p <num>      TCP port number to listen on (default: 11211)
-U <num>      UDP port number to listen on (default: 11211, 0 is off)
-s <file>     UNIX socket path to listen on (disables network support)
-a <mask>     access mask for UNIX socket, in octal (default: 0700)
-l <ip_addr>  interface to listen on (default: INADDR_ANY, all addresses)
-d            run as a daemon
-r            maximize core file limit
-u <username> assume identity of <username> (only when run as root)
-m <num>      max memory to use for items in megabytes (default: 64 MB)
-M            return error on memory exhausted (rather than removing items)
-c <num>      max simultaneous connections (default: 1024)
-k            lock down all paged memory.  Note that there is a
              limit on how much memory you may lock.  Trying to
              allocate more than that would fail, so be sure you
              set the limit correctly for the user you started
              the daemon with (not for -u <username> user;
              under sh this is done with 'ulimit -S -l NUM_KB').
-v            verbose (print errors/warnings while in event loop)
-vv           very verbose (also print client commands/reponses)
-vvv          extremely verbose (also print internal state transitions)
-h            print this help and exit
-i            print memcached and libevent license
-P <file>     save PID in <file>, only used with -d option
-f <factor>   chunk size growth factor (default: 1.25)
-n <bytes>    minimum space allocated for key+value+flags (default: 48)
-L            Try to use large memory pages (if available). Increasing
              the memory page size could reduce the number of TLB misses
              and improve the performance. In order to get large pages
              from the OS, memcached will allocate the total item-cache
              in one large chunk.
-D <char>     Use <char> as the delimiter between key prefixes and IDs.
              This is used for per-prefix stats reporting. The default is
              ":" (colon). If this option is specified, stats collection
              is turned on automatically; if not, then it may be turned on
              by sending the "stats detail on" command to the server.
-t <num>      number of threads to use (default: 4)
-R            Maximum number of requests per event, limits the number of
              requests process for a given connection to prevent
              starvation (default: 20)
-C            Disable use of CAS
-b            Set the backlog queue limit (default: 1024)
-B            Binding protocol - one of ascii, binary, or auto (default)
-I            Override the size of each slab page. Adjusts max item size
              (default: 1mb, min: 1k, max: 128m)
初始化Memcached:
memcached -u root -d -m 512 -p 11211 -l 192.168.56.12

[root@ogg1 bin]# ps -ef |grep mem
root      4382     1  0 02:01 ?        00:00:00 memcached -u root -d -m 512 -p 11211 -l 192.168.56.12
查看當前Memcached的狀態:
[root@ogg1 bin]# telnet 192.168.56.12 11211
Trying 192.168.56.12...
Connected to 192.168.56.12.
Escape character is '^]'.
stats
STAT pid 4382
STAT uptime 7288
STAT time 1418893354
STAT version 1.4.4
STAT pointer_size 64
STAT rusage_user 0.353946
STAT rusage_system 0.379942
STAT curr_connections 5
STAT total_connections 8
STAT connection_structures 6
STAT cmd_get 0
STAT cmd_set 0
STAT cmd_flush 0
STAT get_hits 0
STAT get_misses 0
STAT delete_misses 0
STAT delete_hits 0
STAT incr_misses 0
STAT incr_hits 0
STAT decr_misses 0
STAT decr_hits 0
STAT cas_misses 0
STAT cas_hits 0
STAT cas_badval 0
STAT auth_cmds 0
STAT auth_errors 0
STAT bytes_read 144
STAT bytes_written 1732
STAT limit_maxbytes 536870912
STAT accepting_conns 1
STAT listen_disabled_num 0
STAT threads 4
STAT conn_yields 0
STAT bytes 0
STAT curr_items 0
STAT total_items 0
STAT evictions 0
END

對應參數解釋:
pid  memcache服務器的進程ID
uptime  服務器已經運行的秒數
time  服務器當前的unix時間戳
version  memcache版本
pointer_size  當前操作系統的指針大小(32位系統一般是32bit)
rusage_user  進程的累計用戶時間
rusage_system  進程的累計系統時間
curr_items  服務器當前存儲的items數量
total_items  從服務器啟動以後存儲的items總數量
bytes  當前服務器存儲items占用的字節數
curr_connections  當前打開著的連接數
total_connections  從服務器啟動以後曾經打開過的連接數
connection_structures  服務器分配的連接構造數
cmd_get  get命令(獲取)總請求次數
cmd_set  set命令(保存)總請求次數
get_hits  總命中次數
get_misses  總未命中次數
evictions  為獲取空閒內存而刪除的items數(分配給memcache的空間用滿後需要刪除舊的items來得到空間分配給新的items)
bytes_read  總讀取字節數(請求字節數)
bytes_written  總發送字節數(結果字節數)
limit_maxbytes  分配給memcache的內存大小(字節)
threads  當前線程數