MySQL DBA剛入職時如何快速擁抱新的環境
方法何其多、這裡介紹的是懶人做法、也就是、借助工具
但是、生產環境是不能隨便安裝程序的、腫麼辦?
沒關系、我們偉大的percona 已經為我們考慮周詳鳥
這裡、我們要借助三個工具:
① pt-summary:綠色純天然、免安裝、下載即用、收集MySQL Server所在OS的基本信息
② pt-mysql-summary:本地安裝、然後遠程收集MySQL Server的基本信息
③ innotop:將MySQL Server的信息分析的粒度做細、讓你深入觀察和監控MySQL Server、同樣可以遠程監控
關於 pt-summary、這個工具幾乎把這個服務器的配置從裡到外扒了遍、
而且、所顯示的參數也非常明了、有興趣的朋友到官網下個、跑一下就出來
下面重點介紹的是 pt-mysql-summary和innotop
先瞧瞧 pt-mysql-summary
[plain]
[mysql@odd ~]$ pt-mysql-summary --user=david --password=123 --host=62.131.164.222
㈠ 第一部分
# Percona Toolkit MySQL Summary Report #######################
System time | 2013-06-12 08:58:40 UTC (local TZ: CST +0800)
# Instances ##################################################
Port Data Directory Nice OOM Socket
===== ========================== ==== === ======
3306 /home/mysql/mysql/data 0 0 /tmp/mysql.sock
--前面這兩部分展示了MySQL 實例的基本概況
--實際上、這裡可以列出多個實例、不過、我這裡僅有一個
㈡ 第二部分
# MySQL Executable ###########################################
Path to executable | /home/mysql/mysql/bin/mysqld
Has symbols | Yes
# Report On Port 3306 ########################################
User | david@%
Time | 2013-06-12 16:57:58 (CST)
Hostname | cdio
Version | 5.5.16-log Source distribution
Built On | Linux x86_64
Started | 2013-06-11 15:26 (up 1+01:31:13)
Databases | 6
Datadir | /home/mysql/mysql/data/
Processes | 20 connected, 2 running
Replication | Is not a slave, has 0 slaves connected
Pidfile | /home/mysql/mysql/data/cdio.pid (does not exist)
--這部分是對 MySQL 實例(PS:這裡特指3306、因為還可存在其他實例)的基本情況再次做報表、當然、比前面部分來得詳細些
--有個參數需要特別注意、Time 指的是MySQL 服務器的當前時間、而不是MySQL 服務器所在的系統的時間
㈢ 第三部分
# Processlist ################################################
Command COUNT(*) Working SUM(Time) MAX(Time)
------------------------------ -------- ------- --------- ---------
Query 1 1 0 0
Sleep 20 0 35000 4000
User COUNT(*) Working SUM(Time) MAX(Time)
------------------------------ -------- ------- --------- ---------
david 1 1 0 0
root 9 0 0 0
shaoyun 10 0 0 0
Host COUNT(*) Working SUM(Time) MAX(Time)
------------------------------ -------- ------- --------- ---------
110.80.147.20 1 1 0 0
110.84.245.124 6 0 0 0
27.151.68.106 4 0 0 0
localhost 9 0 0 0
db COUNT(*) Working SUM(Time) MAX(Time)
------------------------------ -------- ------- --------- ---------
cdio 15 0 0 0
NULL 5 1 0 0
State COUNT(*) Working SUM(Time) MAX(Time)
------------------------------ -------- ------- --------- ---------
20 0 0 0
NULL 1 1 0 0
--這部分的內容來自 show processlist 、我們先看看未經過統計的 show processlist的 內容、如下:
--
mysql> show processlist;
+------+---------+---------------------+------+---------+------+-------+------------------+
| Id | User | Host | db | Command | Time | State | Info |
+------+---------+---------------------+------+---------+------+-------+------------------+
| 1508 | shaoyun | 130.84.225.124:4373 | cdio | Sleep | 3523 | | NULL |
| 1510 | shaoyun | 130.84.225.124:4385 | cdio | Sleep | 2322 | | NULL |
| 1513 | shaoyun | 27.161.68.106:2585 | NULL | Sleep | 7866 | | NULL |
| 1514 | shaoyun | 27.161.68.106:2586 | NULL | Sleep | 7866 | | NULL |
| 1522 | shaoyun | 27.161.68.106:3107 | NULL | Sleep | 6861 | | NULL |
| 1529 | root | localhost | cdio | Sleep | 4426 | | NULL |
| 1557 | root | localhost:59459 | cdio | Sleep | 7 | | NULL |
| 1579 | shaoyun | 165.77.122.42:56966 | cdio | Sleep | 433 | | NULL |
| 1580 | root | localhost | cdio | Sleep | 239 | | NULL |
| 1582 | shaoyun | 27.161.68.126:5640 | cdio | Sleep | 164 | | NULL |
| 1583 | root | localhost | NULL | Query | 0 | NULL | show processlist |
+------+---------+---------------------+------+---------+------+-------+------------------+
--不難看出、這是對每一列都做了統計
㈣ 第四部分
# Status Counters (Wait 10 Seconds) ##########################
Variable Per day Per second 295 secs
Bytes_received 90000000 1000 4000
Bytes_sent 600000000 7000 22500
Com_admin_commands 1
Handler_rollback 80
Handler_update 6000
Handler_write 20000 5
Innodb_buffer_pool_pages_flushed 2250 1
Innodb_buffer_pool_read_requests 2250000 25 125
Innodb_buffer_pool_reads 800
Innodb_buffer_pool_write_requests 10000 7
Innodb_data_fsyncs 1250
Innodb_data_read 15000000 175 100
Innodb_data_reads 900
Innodb_data_writes 2000 1
Innodb_data_written 40000000 450 25000
Innodb_dblwr_pages_written 1250
Innodb_dblwr_writes 150
Innodb_log_write_requests 1750 1
Innodb_log_writes 600
Innodb_os_log_fsyncs 700
Innodb_os_log_written 1000000 10 600
--這部分內容取自 show global status 、僅收集哪些變化的量
--比較有價值的應該是第三列、取自兩張快照、除以變化量、算出每秒的變化
㈤ 第五部分
# Table cache ################################################
Size | 64
Usage | 100%
--顯示表緩存的大小、Usage表示在用百分比、這是個近視值
㈥ 第六部分
# Plugins ####################################################
InnoDB compression | ACTIVE
--顯示指定的插件程序以及它們的狀態
㈦ 第七部分
# Query cache ################################################
query_cache_type | ON
Size | 0.0
Usage | 0%
HitToInsertRatio | 0%
--這部分是關於查詢緩存基本情況
㈧ 第八部分
# Schema #####################################################
Would you like to mysqldump -d the schema and analyze it? y/n y
There are 6 databases. Would you like to dump all, or just one?
Type the name of the database, or press Enter to dump all of them.
Database Tables Views SPs Trigs Funcs FKs Partn
cdio 61 65
jiradb 130 6
mysql 22
test
Database InnoDB MyISAM
cdio 61
jiradb 130
mysql 22
test
Database BTREE
cdio 193
jiradb 274
mysql 31
c t
h i
a m
r e
s
t
a
m
p
Database === ===
cdio 114 155
jiradb 1 346
mysql 8 3
test
--這部分便是 mysqldump --no-data 跑出來的數據
--第一個小部分指明每個庫有多少張表、視圖、存儲過程、觸發器、函數、外鍵約束等
--第二個小部分指明每個庫有多少張表使用了不同的存儲引擎
--第三個小部分指明每個庫有多少索引類型
--第四個小部分指明每個庫數據類型的分布情況、可能比較難看、因為列是豎著放、比如第一列是char
㈨ 第九部分
# Noteworthy Technologies ####################################
Full Text Indexing | No
Geospatial Types | No
Foreign Keys | Yes
Partitioning | No
InnoDB Compression | No
SSL | No
Explicit LOCK TABLES | No
Delayed Insert | No
XA Transactions | No
NDB Cluster | No
Prepared Statements | No
Prepared statement count | 0
--這部分顯示了一些關鍵技術是否被用上、如:全文索引、XA等
(十)第十部分
# InnoDB #####################################################
Version | 1.1.8
Buffer Pool Size | 128.0M
Buffer Pool Fill | 10%
Buffer Pool Dirty | 0%
File Per Table | ON
Page Size | 16k
Log File Size | 2 * 5.0M = 10.0M
Log Buffer Size | 8M
Flush Method |
Flush Log At Commit | 1
XA Support | ON
Checksums | ON
Doublewrite | ON
R/W I/O Threads | 4 4
I/O Capacity | 200
Thread Concurrency | 0
Concurrency Tickets | 500
Commit Concurrency | 0
Txn Isolation Level | REPEATABLE-READ
Adaptive Flushing | ON
Adaptive Checkpoint |
Checkpoint Age | 0
InnoDB Queue | 0 queries inside InnoDB, 0 queries in queue
Oldest Transaction | 0 Seconds
History List Len | 1899
Read Views | 1
Undo Log Entries | 0 transactions, 0 total undo, 0 max undo
Pending I/O Reads | 0 buf pool reads, 0 normal AIO, 0 ibuf AIO, 0 preads
Pending I/O Writes | 0 buf pool (0 LRU, 0 flush list, 0 page); 0 AIO, 0 sync, 0 log IO (0 log, 0 chkp); 0 pwrites
Pending I/O Flushes | 0 buf pool, 0 log
Transaction States | 16xnot started
--這部分顯示了InnoDB 的基本配置
--Buffer Pool Fill和Buffer Pool Dirty是近視值
(11)第11部分
# MyISAM #####################################################
Key Cache | 16.0M
Pct Used | 20%
Unflushed | 0%
--這部分是MyISAM的部分
(12)第12部分
# Security ###################################################
Users | 9 users, 1 anon, 4 w/o pw, 9 old pw
Old Passwords | ON
--這部分從 grants table 的mysql表提取出來
--顯示了顯示了有多少用戶以及各種可能的安全配置
(13)第13部分
# Binary Logging #############################################
Binlogs | 12
Zero-Sized | 0
Total Size | 62.5M
binlog_format | MIXED
expire_logs_days | 0
sync_binlog | 0
server_id | 1
binlog_do_db |
binlog_ignore_db |
--這部分顯示了二進制日志的配置
(14)第14部分
# Noteworthy Variables #######################################
Auto-Inc Incr/Offset | 1/1
default_storage_engine | InnoDB
flush_time | 0
init_connect |
init_file |
sql_mode |
join_buffer_size | 128k
sort_buffer_size | 512k
read_buffer_size | 256k
read_rnd_buffer_size | 512k
bulk_insert_buffer | 0.00
max_heap_table_size | 16M
tmp_table_size | 16M
max_allowed_packet | 1M
thread_stack | 256k
log | OFF
log_error | /home/mysql/mysql/log/alert.log
log_warnings | 1
log_slow_queries | ON
log_queries_not_using_indexes | OFF
log_slave_updates | OFF
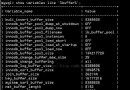
--這部分展示了服務器的幾個關鍵配置
(15)第15部分
# Configuration File #########################################
Config File | /etc/my.cnf
[client]
port = 3306
socket = /tmp/mysql.sock
[mysqld]
port = 3306
socket = /tmp/mysql.sock
basedir = /home/mysql/mysql
datadir = /home/mysql/mysql/data
log-error = /home/mysql/mysql/log/alert.log
log_slow_queries = /home/mysql/mysql/log/slow.log
skip-external-locking
key_buffer_size = 16M
max_allowed_packet = 1M
table_open_cache = 64
sort_buffer_size = 512K
net_buffer_length = 8K
read_buffer_size = 256K
read_rnd_buffer_size = 512K
myisam_sort_buffer_size = 8M
innodb_file_per_table = 1
log-bin = mysql-bin
binlog_format = mixed
server-id = 1
sync_binlog = 1
innodb_support_xa = 1
innodb_flush_log_at_trx_commit = 2
[mysqldump]
quick
max_allowed_packet = 16M
[mysql]
no-auto-rehash
[myisamchk]
key_buffer_size = 20M
sort_buffer_size = 20M
read_buffer = 2M
write_buffer = 2M
[mysqlhotcopy]
interactive-timeout
# The End ####################################################
--如您所見、這部分完完全全來自 my.cnf、這裡不贅述了
其實分析完 pt-mysql-summary 之後、你基本就已經對你即將管理的Server知根知底了
接下來的 Innotop 能給您想知道的部分錦上添花的作用
更多了解請查詢:code.google.com/p/innotop
㈠ 安裝
# perl -MCPAN -eshell
CPAN> install Time::HiRes
CPAN> install Term::ReadKey
CPAN> install DBI
CPAN> install DBD::mysql
# wget https://innotop.googlecode.com/files/innotop-1.9.0.tar.gz
# tar -zxv -f innotop-1.9.0.tar.gz
# cd innotop-1.9.0
# perl Makefile.PL
# make install
㈡ 進入
# innotop -uroot -p123 -h127.0.0.1
㈢ 使用
進入第一件事情就是按 ? 號、然後innotop就會自個教你如何使用
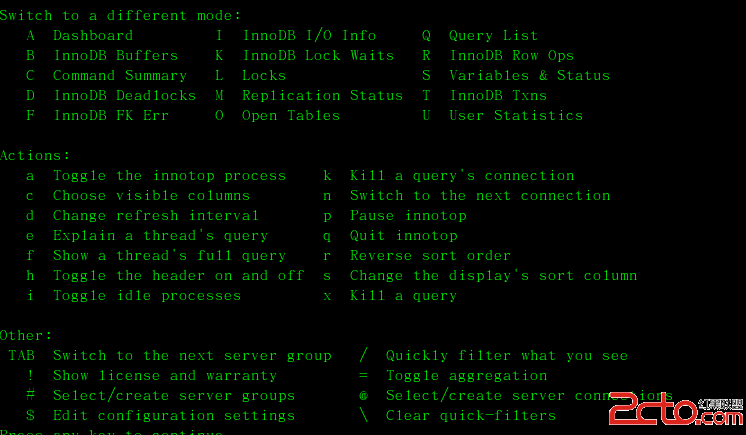 舉個例子、如果你想查詢MySQL當前執行的SQL、您可以這麼做:
按 Q 進入 Query list模式
然後、按 e並輸入thread ID顯示執行計劃
舉個例子、如果你想查詢MySQL當前執行的SQL、您可以這麼做:
按 Q 進入 Query list模式
然後、按 e並輸入thread ID顯示執行計劃