今天用實例總結一下group by的用法。
歸納一下:group by:ALL ,Cube,RollUP,Compute,Compute by
創建數據腳本
Create Table SalesInfo
(Ctiy nvarchar(50),
OrderDate datetime,
OrderID int
)
insert into SalesInfo
select N'北京','2014-06-09',1001
union all
select N'北京','2014-08-09',1002
union all
select N'北京','2013-10-09',1009
union all
select N'大連','2013-08-09',4001
union all
select N'大連','2013-10-09',4002
union all
select N'大連','2013-05-12',4003
union all
select N'大連','2014-11-11',4004
union all
select N'大連','2014-12-11',4005
首先執行以下腳本:
select Ctiy,count(OrderID) as OrderCount
from
SalesInfo
group by Ctiy
with cube

可以看到多出了一行 是對所有的訂單數的匯總
下一個腳本:
select Ctiy,Year(OrderDate) as OrderYear,count(OrderID) as OrderCount
from
SalesInfo
group by Ctiy,Year(OrderDate)
with cube

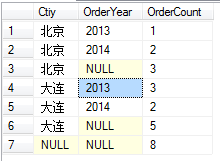
可以看出來對分組中的維度都進行了匯總,並且還有一個訂單的總和
下一個腳本(注意出現了rollup):
select Ctiy,Year(OrderDate) as OrderYear,count(OrderID) as OrderCount
from
SalesInfo
group by Ctiy,Year(OrderDate)
with rollup

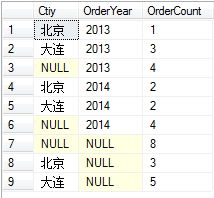
使用rollup會對group by列出的第一個分組字段進行匯總運算
下一個腳本:
select Ctiy,count(OrderID) as OrderCount
from
SalesInfo
where
Ctiy = N'大連'
group by all Ctiy
我們會看到 使用group by all 後,不符合條件的城市也會出現,只是訂單數是零
需要注意的是 All 不能和 cube 和 rollup一起使用,和having一起使用的話,All的功能會失效.
下一個腳本:
select Ctiy,orderdate,orderid
from
SalesInfo
compute count(orderid)

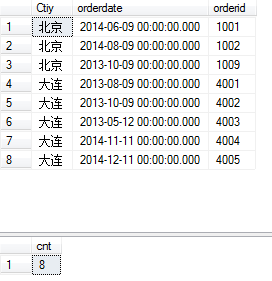
顯示了兩個結果集,一個是訂單結果集,一個是訂單總數結果集
最後一個腳本:
select Ctiy,orderdate,orderid
from
SalesInfo
order by Ctiy
compute count(orderid) by Ctiy

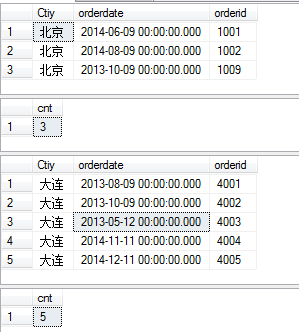
按照不同的城市,分別顯示該城市的訂單信息,一個顯示該城市的所有訂單數量
就先說這些了.
Group by 是SQL Server 中常用的一種語法,語法如下:
[ GROUP BY [ ALL ] group_by_expression [ ,...n ] [ WITH { CUBE | ROLLUP } ]]
1、最常用的就是這種語法,如下:
Select CategoryID, AVG(UnitPrice), COUNT(UnitPrice) FROM dbo.Products Where UnitPrice 30GROUP BY CategoryID ORDER BY CategoryID DESC
這個語句查詢出,所有產品分類的產品平均單價,單價計數。並且單價在 30 以上的記錄。
2、再看看這種語法,如下:
Select CategoryID, AVG(DISTINCT UnitPrice), COUNT(DISTINCT UnitPrice) FROM dbo.Products Where UnitPrice 30GROUP BY CategoryID ORDER BY CategoryID DESC
使用 DISTINCT 的時候,將會去除重復的價格平均單價。
3、如果希望在分類統計之後,再使用條件過濾,下面的語句可以做為參數:Select CategoryID, SUM(UnitPrice) AS SumPriceFROM dbo.ProductsGROUP BY CategoryIDHAVING SUM(UnitPrice) 300HAVING 與 Where 語句類似,Where 是在分類之前過濾,而 HAVING 是在分類之後過濾。它和 Where 一樣使用 AND、OR、NOT、LIKE 組合使用。
4、如果希望再在分類統計中,添加匯總行,可以使用以下語句:
Select CategoryID, SUM(UnitPrice), GROUPING(CategoryID) AS 'Grouping'FROM dbo.ProductsGROUP BY CategoryID WITH ROLLUP
Grouping 這一列用於標識出哪一行是匯總行。它使用 ROLLUP 操作添加匯總行。
5、如果使用 WITH CUBE 將會產生一個多維分類數據集,如下:
Select CategoryID, SupplierID, SUM(UnitPrice) AS SumPriceFROM dbo.ProductsGROUP BY CategoryID, SupplierID WITH CUBE
它會產生一個交叉表,產生所有可能的組合匯總。
6、使用 ROLLUP CUBE 會產生一個 NULL 空值,可以使用以下語法解決,如下:
Select CASE WHEN (GROUPING(SupplierID) = 1) THEN '-1' ELSE SupplierID END AS SupplierID, SUM(UnitPrice) AS QtySumFROM dbo.ProductsGROUP BY SupplierID WITH CUBE它首先檢查當前行是否為匯總行,如果是就可以設置一個值,這裡設置為 '-1' 。
group by是分組顯示的意思,要和統計語句,如sum結合起來用的。
如果是要排序的話,你應該使用order by性別
如果要用group by ,你可以使用下面的命令來統計男女生人數
select 性別,count(*) from cj group by 性別